Calculate Volumes by Five Methods
For this tutorial, we'll be using a sample stockpile drawing and
calculating its volume using five distinct techniques:
- Stockpile Volumes:
Creates grid surfaces from perimeter polyline and surface entities
and calculates volumes in one command
- Volumes By Layers:
Creates grid surfaces from existing and design layers and
calculates volumes in one command
- Two Grid Surface
Volumes: Calculates volumes between two grid
files
- Volumes By
Triangulation: Calculates volumes between two
triangulation files
- Calculate Sections
Volumes: Calculates volumes between two section files
using volumes by average end areas
Each of these routines has its own advantages. You can choose
the routine that best suits your data or run multiple methods as a
check of the volumes. The volume reports for each of these routines
will vary slightly due to using different types of surface models
that have different resolutions. These volume differences should be
less than 2%.
A Results Summary of the various volume
methodologies is also provided.
If there is a greater difference, try increasing the resolution
of the surface models. For grids, make the grid cell size smaller
and for sections, make the station interval smaller. If there is
still a significant difference, then the cause should be
investigated by checking the source data.
Common Steps
The following are common preparation steps for all five volume
methods:
- Click the Windows desktop icon for Carlson to start the
program.
- If you get the Start Page, pick
Open Files.
- If you get the Startup Wizard
dialog box, click the Browse button.
- If you are taken directly into CAD, click File --
Open.
Browse/navigate to the default folder location of
C:\Carlson Projects and open the
example1.dwg file.
Use the File -- Save As to save a copy named
example1-v.dwg. Completing this tutorial will
alter the drawing file and by renaming the file from the start,
you'll keep the original file intact (allowing you to run through
the tutorial a second time if desired). This is also a good
practice to keep when working on drawings from 3rd parties.
- Ensure you are in the Civil program by issuing the
Settings -- Carlson Menus -- Civil Menu command.
Since our drawing contains point data, let's house it in a related
coordinate file for future use. Issue the Points --
Set
Coordinate File command to display a dialog box similar to that
shown below:
Set the value as shown above and click Open when
ready. Next, issue the Points -- Point Utilities --
Update CRD File from Drawing command (also found under Points
--
Coordinate File Utilities) to display a dialog box similar to
that shown below:
Accept the default values and click OK when ready.
When prompted:
Select Carlson, LDD, Softdesk, InRoads,
EaglePt, Geodimeter, Leica or MicroSurvey Points.
[FILter]/<Select entities>:
type ALL and press Enter
[FILter]/<Select entities>:
press Enter
- Due to the shape of the data (and in an effort to get
consistent results), we'd like to develop a boundary (or
inclusion) polyline around the data set. There are several
ways to accomplish this:
- Through the use of the Survey module
and its Survey -- Draw
Field to Finish command, or,
- Through the use of the Draw -- 3D Polyline
command, or,
- Through the use of the Draw -- Shrink-Wrap
Entities command, or,
- Through the use of the Surface --
Stockpile/Pond/Pit Volumes --
Draw 3DPoly Perimeter command (run it now) to display a dialog
box similar to that shown below:
 Set the values
as shown above (click OK when ready) and when
prompted:
Set the values
as shown above (click OK when ready) and when
prompted:
[Continue/Extend/Follow/Options/<Pick point
or point numbers>]: type the range
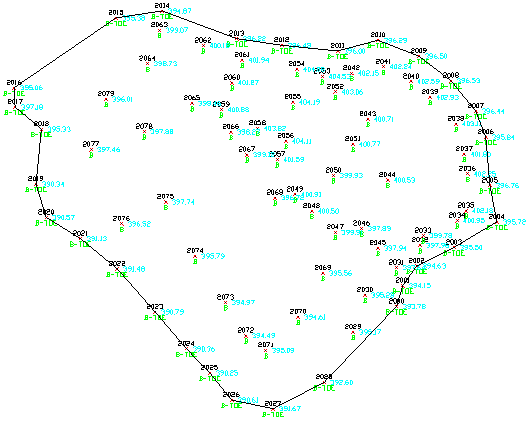
of 2000-2028 and press Enter
[Arc/Close/Distance/Extend/Follow/Line/Undo/<Pick point
or point numbers>]: type C and press
Enter
The drawing should resemble that shown below:
Let's begin the volume calculation processes.
Volume Method 1 - Calculate Stockpile Volume
The Calculate Stockpile Volume routine is based
on a grid surface methodology like the Two Surface Volumes discussion below. The
difference with this routine is that it builds the grid surfaces
within the routine to save time otherwise needed to build the grid
files. The fewer steps make this routine faster and easier but it
doesn't have options for checking surfaces. Instead the input data
entities should be checked before running this routine. Also,
Calculate Stockpile Volume only applies to volumes
calculations when the volume is all Fill.
- Issue the Surface -- Stockpile/Pond/Pit Volumes --
Calculate Stockpile Volume command. When prompted:
Select stockpile entities and
perimeter.
[FILter]/<Select entities>:
type ALL and press Enter (The program
looks for a closed 3D polyline on the PERIMETER layer to use as the
inclusion perimeter and the base surface model. If this polyline is
not found, then the program will prompt to select the perimeter
polyline. All the selected entities including the perimeter are
used to model the second surface of the stockpile top).
[FILter]/<Select entities>:
press Enter
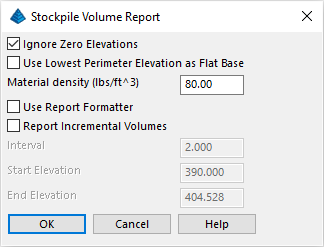
The routine offers various reporting capabilities. Let's assume a
typical density for a pile of road salt as illustrated below and
click OK when ready:
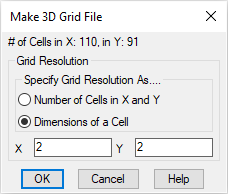
Specify the grid resolution as shown in the dialog below and click
OK when ready:
The result is summarized in a volume report in the
Standard Report Viewer similar to that shown below:
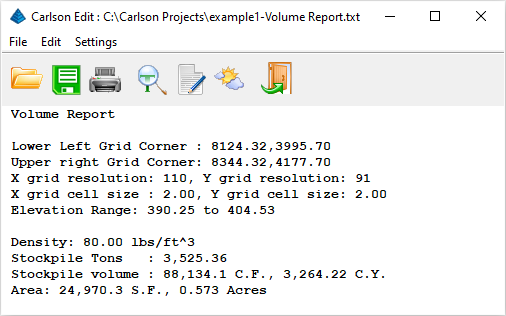
Click the Exit (Doorway) button to dismiss the
report.
NOTE: The limits of the grid are determined
automatically and shown in the report. For the sake of accuracy,
the next two methods will use the grid parameters shown above.
NOTE: For situations involving a Cut-only
scenario (such as a pond or pit), use the Surface --
Stockpile/Pond/Pit Volumes --
Calculate Pond/Pit Volume command.
Volume Method 2 - Volumes By Layers
Let's explore a simple routine that handles both Cut and Fill
scenarios.
- Issue the Surface -- Volumes By Grid Surface --
Volumes By Layers command. When prompted:
Pick Lower Left limit of surface area
<8124.32,3995.70>: indicate the
values shown to the left and press Enter (or pick a lower
left limit)
Pick Upper Right limit of surface area
<8344.32,4177.70>: indicate the
values shown to the left and press Enter (or pick an upper
right limit)
Specify the grid resolution as shown in the dialog below and click
OK when ready:
A dialog box similar to that shown below appears:
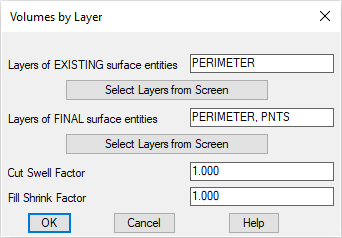
Click the Select Layers from Screen buttons and
when prompted:
- Select entities on layers of Existing
surface.
[FILter]/<Select entities>:
pick the PERIMETER polyline and press
Enter
- Select entities on layers of Final
surface.
[FILter]/<Select entities>:
type ALL and press Enter twice
Once the values are as shown above, click OK when
ready. Prompting resumes:
Select surface entities on corresponding
layers.
[FILter]/<Select entities>:
type ALL and press Enter twice
Select the Inclusion perimeter polylines or
ENTER for none:
[FILter]/<Select entities>:
pick the PERIMETER polyline and press
Enter
[FILter]/<Select entities>:
press Enter
Select the Exclusion perimeter polylines or
ENTER for none.
[FILter]/<Select entities>:
press Enter
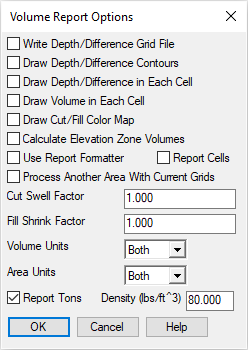
Volume Report Options (dialog):
set the values as shown below and click
OK when ready:
The volume report similar to that shown below appears:
Click the Exit (Doorway) button to dismiss the
report.
NOTE: Similar to Calculate
Stockpile Volume, this routine builds the grid surfaces within
the routine to save the steps of creating grid files. The
difference between this routine and the Calculate Stockpile
Volume routine is that Volumes By Layers uses
entities on specified layers for Existing and
Final scenarios to build the surfaces and it will
calculate both Cut and Fill volumes.
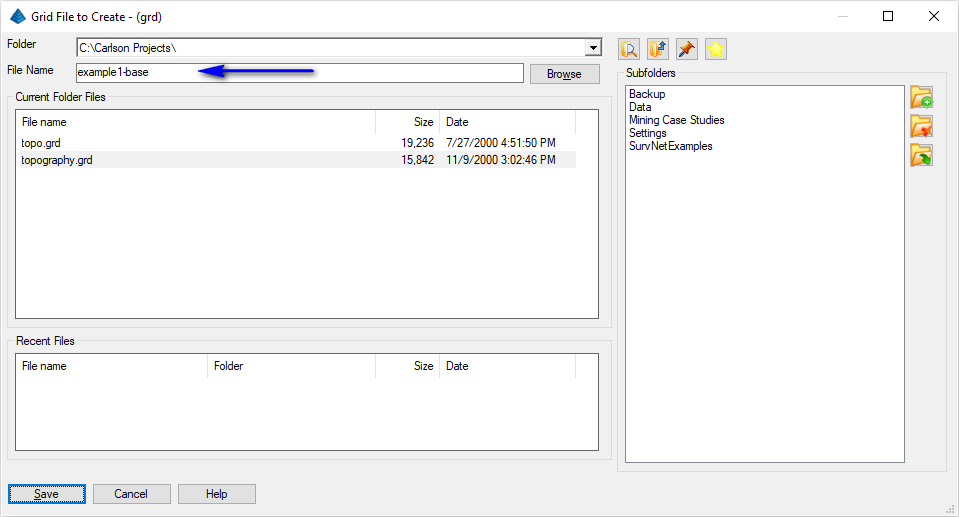
Volume Method 3 - Two Grid Surface Volumes
For the next example, we must create the two grid files; one
representing an assumed base-ground (Existing) surface,
the other representing the surface of the pile
(Final).
- Issue the Surface --
Make 3D Grid File command. When prompted:
Grid File to Create (dialog):
supply the file name indicated below and click
Save when ready:
A dialog box similar to that shown below appears. Set the values as
shown and click OK when ready:
Prompting resumes:
Pick first grid corner
<8124.32,3995.70>: press
Enter (notice the grid limit from the previous example is
defaulted)
Pick opposite grid corner
<8344.32,4177.70>: press
Enter
Select the Inclusion perimeter polylines or
ENTER for none.
[FILter]/<Select entities>:
pick the PERIMETER polyline
[FILter]/<Select entities>:
press Enter
Select the Exclusion perimeter polylines or
ENTER for none.
[FILter]/<Select entities>:
press Enter
Select points, lines, polylines and faces to
grid from.
[FILter]/<Select entities>:
pick the PERIMETER polyline again and press
Enter
[FILter]/<Select entities>:
press Enter
A grid file representing an assumed base-ground (Existing)
surface is written.
- Re-run the Surface -- Make 3D Grid File
command. When prompted:
Grid File to Create (dialog):
supply the file name indicated below and click
Save when ready:
A dialog box similar to that shown below appears. Set the values as
shown and click OK when ready:
NOTE: For the volume routine to follow, the two
grids to compare should have matching grid positions and
resolution. Prompting resumes:
Grid File to Get Position From
(dialog): select the grid file created
earlier and click Open when ready
Select the Inclusion perimeter polylines or
ENTER for none.
[FILter]/<Select entities>:
pick the PERIMETER polyline
[FILter]/<Select entities>:
press Enter
Select the Exclusion perimeter polylines or
ENTER for none.
[FILter]/<Select entities>:
press Enter
Select points, lines, polylines and faces to
grid from.
[FILter]/<Select entities>:
type ALL and press Enter
[FILter]/<Select entities>:
press Enter
A grid file representing the surface of the pile (Final)
is written.
- Optional: Presume we might want to check
the surface(s) just created. This step is optional to verify that
the surfaces are good by checking for bad elevation data points and
that the surfaces follow the data points. Issue the View -- 3D View
-- Surface
File Viewer and when prompted:
Select Surface File (dialog):
select the grid file that was just created and
click Open when ready:
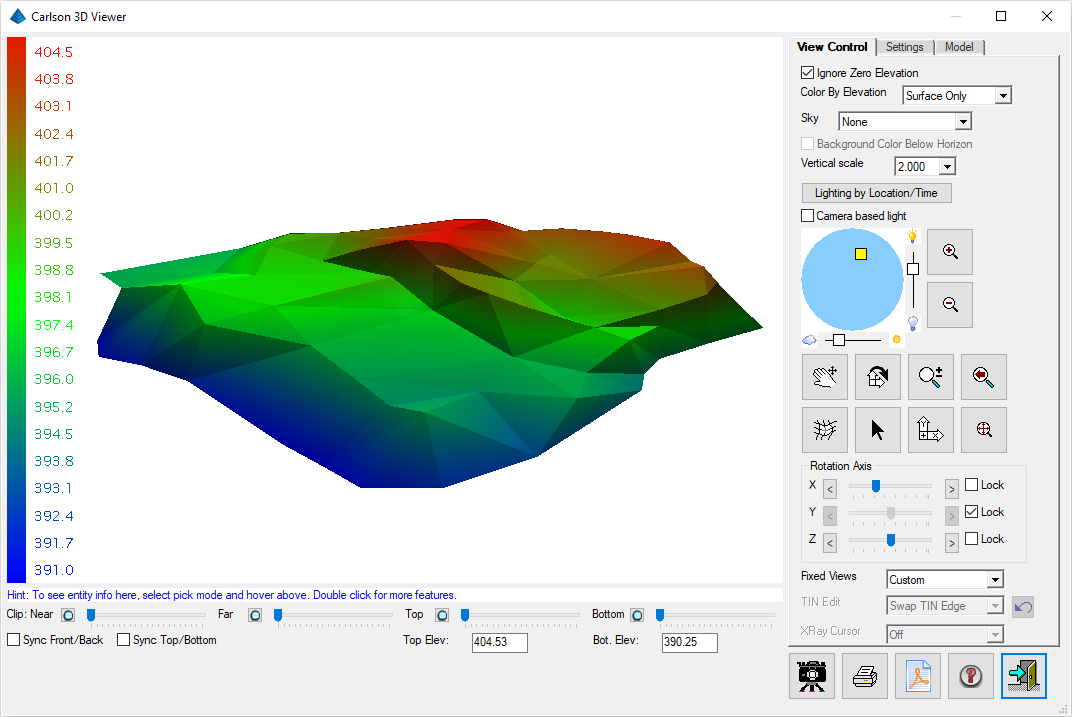
A 3D Viewer window similar to that shown below appears:
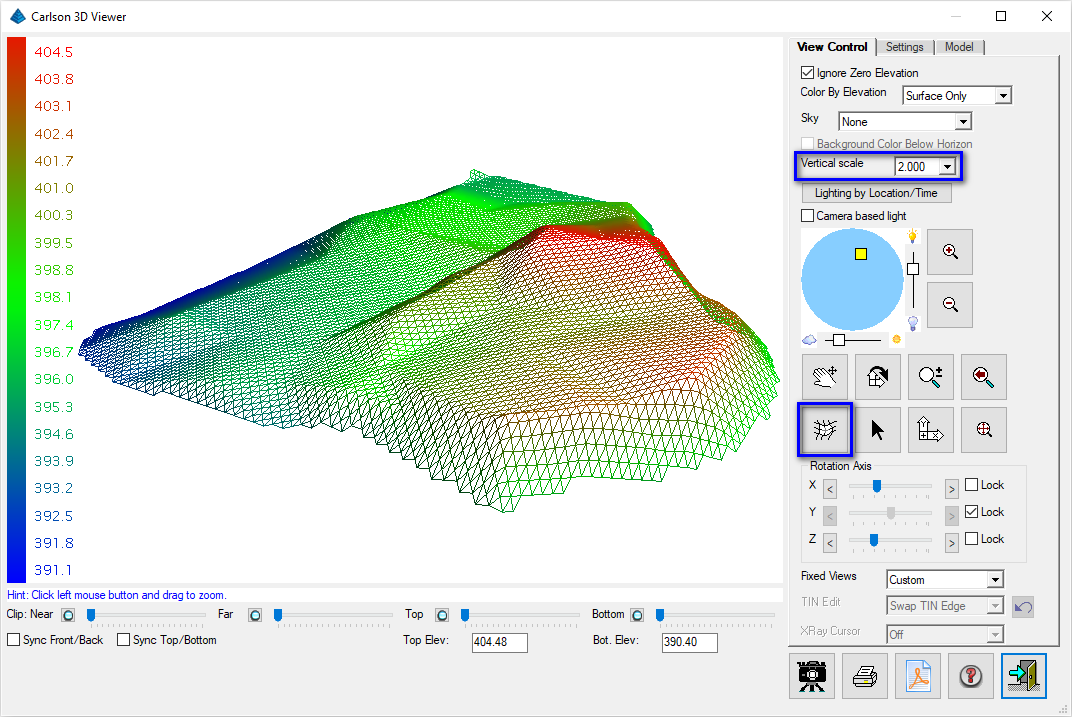
In the 3D Viewer dialog, move the pointer near the outer edge of
the graphic and the cursor will change to an Z symbol which orients
the view about the vertical axis. Moving the cursor to the interior
of the graphic and the cursor will change to an X/Y symbol. Click
and drag from the bottom upward to change the isometric viewing
angle. You can also set the Vertical Scale to 2.0
and enable the Color By Elevation toggle for
better viewing of the elevation difference. Experiment with any
desired remaining options. When ready, click the
Exit (Doorway) button.
- Now, let's check some spot elevations. Issue the Surface --
Surface Inspector command to display a dialog box similar to
that shown below:
Use the highlighted controls to set the values as shown above. When
ready, click the OK button. As you position the
cursor into the data set, notice a real-time reporting of the two
surface elevations as illustrated below:
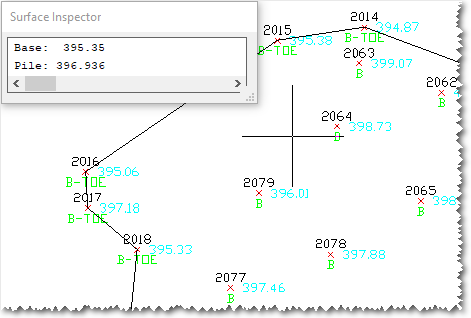
Check that the grid elevations match the point elevations
reasonably well. Remember that the base elevations are using only
the B-TOE points. The elevations won't match exactly with grid
surfaces because the grid model is at the resolution of the grid
cells. When finished checking, press Enter.
- Now that you have the Base and Pile grid
files, issue the Surface -- Volumes By Grid Surface --
Two Grid Surface Volumes command. When prompted:
Select the Inclusion perimeter polylines or
ENTER for none.
[FILter]/<Select entities>:
pick the PERIMETER polyline
[FILter]/<Select entities>:
press Enter
Select the Exclusion perimeter polylines or
ENTER for none.
[FILter]/<Select entities>:
press Enter
Select Base Grid File (dialog):
select the Base grid file and click
Open when ready
Select Final Grid File (dialog):
select the Pile grid file and click
Open when ready
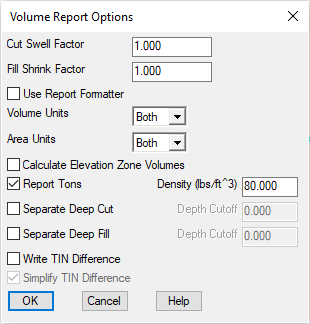
Volume Report Options (dialog):
set the values as shown below and click
OK when ready:
The volume report similar to that shown below appears:
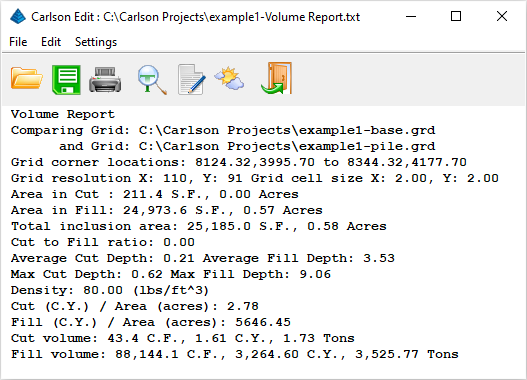
Click the Exit (Doorway) button to dismiss the
report.
NOTE: Although grid files produce
relatively accurate volumes (based on the grid
resolution), their primary value lies in the ability to
hand-calculate the results for validation purposes. With a grid
resolution (e.g. 2' x 2') and the average elevation of
each grid cell (resulting in a grid depth), a grid cell volume can
be computed through traditional means.
Volume Method 4 - Volumes By Triangulation
For precise surface-to-surface volumes, creating
triangulated irregular network (TIN) files is the
preferred methodology.
- Issue the Surface --
Triangulate & Contour command. The following dialog box
(with several "tabs") will appear which you should fill out as
discussed below:
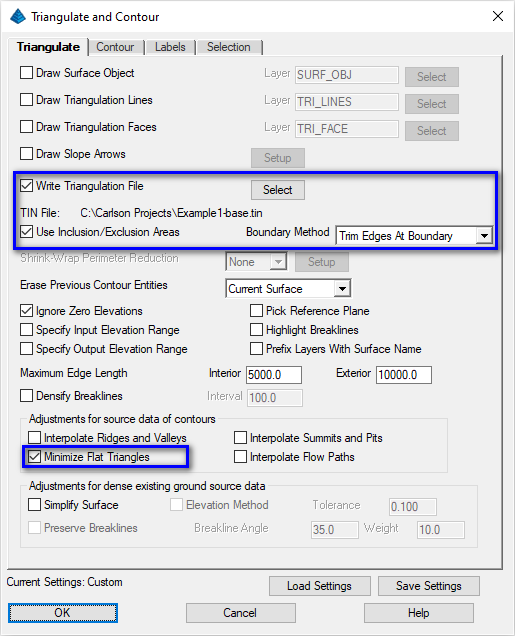
- In the Triangulate tab (as shown above), enable the
Write Triangulation File toggle and click its
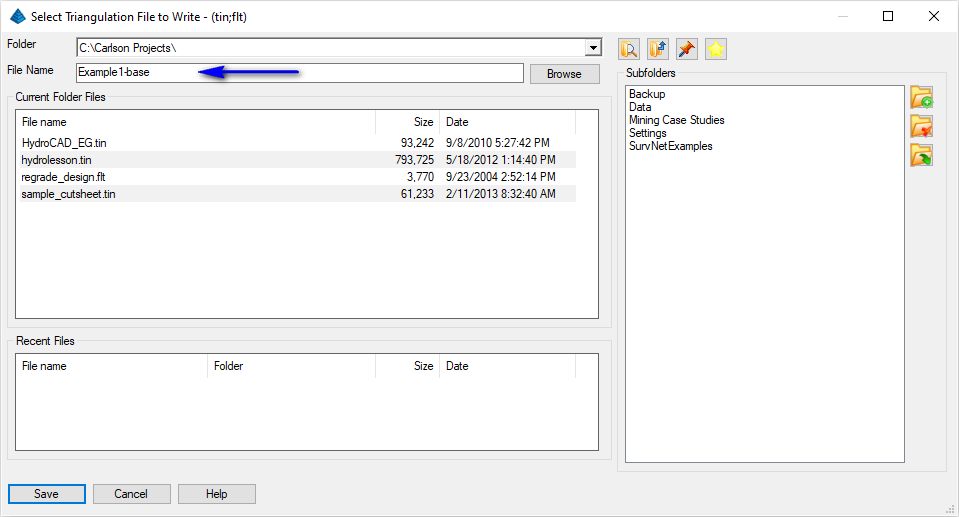
Select button to set the name of a triangulation
(*.tin) file as illustrated below. Click the Save
button on this dialog box so that the results of the triangulation
can be re-used for future purposes. Turn on the Use
Inclusion/Exclusion Areas toggle and set any remaining
options as illustrated above:
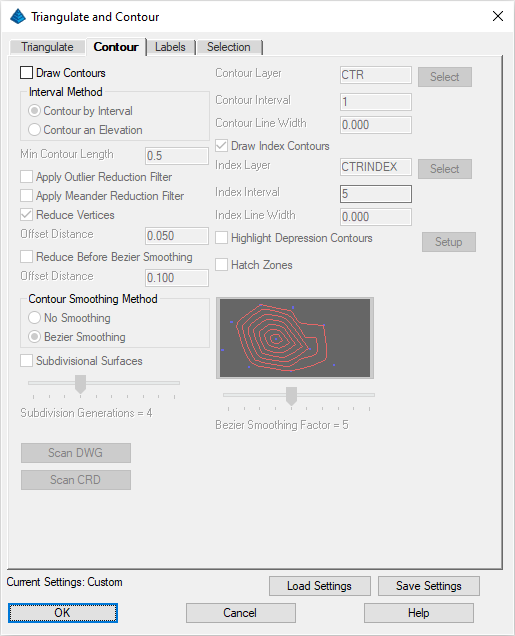
- In the Contour tab, as shown below, toggle off the
Draw Contours option:
Click the OK button from any tab. When prompted:
Select Inclusion perimeter polylines or ENTER
for none.
[FILter]/<Select entities>:
pick the PERIMETER polyline
[FILter]/<Select entities>:
press Enter
Select Exclusion perimeter polylines or ENTER
for none.
[FILter]/<Select entities>:
press Enter
Select points and breaklines to
Triangulate.
[FILter]/<Select entities>:
pick the PERIMETER polyline again and press
Enter
[FILter]/<Select entities>:
press Enter
If a secondary dialog box appears prompting for a coordinate file
(*.crd), click Cancel. A "TIN" file representing
an assumed base-ground (Existing) surface is written.
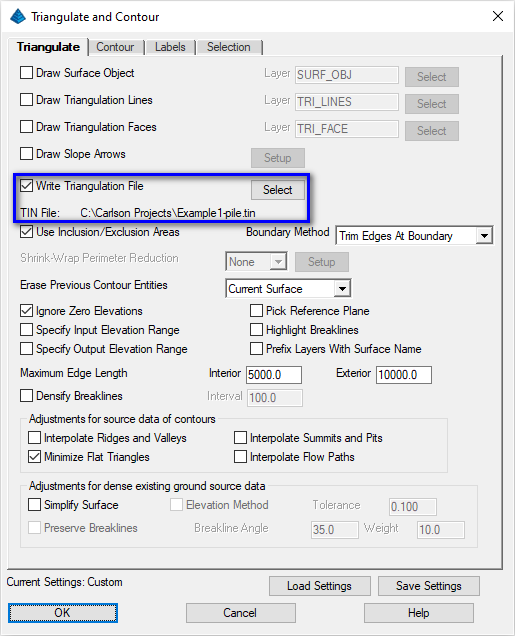
- For the pile TIN, we'll follow the same
general procedure as above but with a few small tweaks. Re-issue
the Surface -- Triangulate & Contour command
and set the values as shown below (click OK when
ready):
When prompted:
Select Inclusion perimeter polylines or ENTER
for none.
[FILter]/<Select entities>:
pick the PERIMETER polyline
[FILter]/<Select entities>:
press Enter
Select Exclusion perimeter polylines or ENTER
for none.
[FILter]/<Select entities>:
press Enter
Select points and breaklines to
Triangulate.
[FILter]/<Select entities>:
type ALL and press Enter
[FILter]/<Select entities>:
press Enter
If a secondary dialog box appears prompting for a coordinate file
(*.crd), click Cancel or select the coordinate file created earlier in this lesson if you
so choose and accept the default parameters that follow.
A "TIN" file representing the pile (Final) surface is
written.
- Optional: Similar to the Check Surfaces step under Two
Grid Surface Volumes, this is an optional step to check that
the surface(s) are correct. Re-issue the View -- 3D View --
Surface File Viewer command and when
prompted:
Select Surface File (dialog):
select the TIN file that was just created and
click Open when ready.
A 3D Viewer window similar to that shown below appears:
When ready, click the Exit (Doorway) button.
- Now that we have our two triangulation files, we can generate a
TIN to TIN prismoidal volume calculation. Of all the volume
methods, this one is the most accurate since all the source data
points are used in the volume model. Issue the Surface -- Volumes
By Triangulation --
Two Triangulation Surface Volumes command. When prompted:
Select EXISTING Surface Triangulation File
(dialog): select the Base TIN
file and click Open when ready
Select FINAL Surface Triangulation File
(dialog): select the Pile grid
file and click Open when ready
Select Inclusion perimeter polylines or ENTER
for none.
[FILter]/<Select entities>:
pick the PERIMETER polyline
[FILter]/<Select entities>:
press Enter
Select Exclusion perimeter polylines or ENTER
for none.
[FILter]/<Select entities>:
press Enter
Volume Report Options (dialog):
set the values as shown below and click
OK when ready:
The volume report similar to that shown below appears:
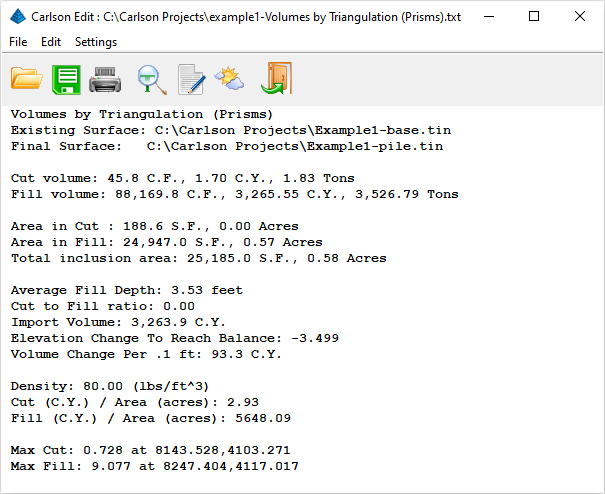
Click the Exit (Doorway) button to dismiss the
report.
Volume Method 5 - Calculate Section Volumes
In roadway/corridor types of projects, volumes by Average
End Area are commonly used. Let's see the results of this
process.
- Our first task will be to draw a centerline (baseline) upon
which the corridor will be based. Issue the Centerline --
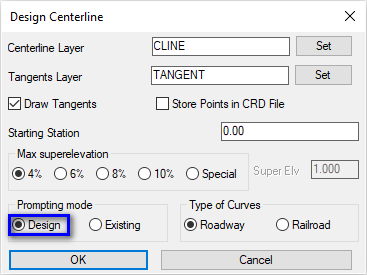
Design Centerline command and when prompted:
Centerline File to Design (dialog):
set the file name as shown below and click
Open when ready
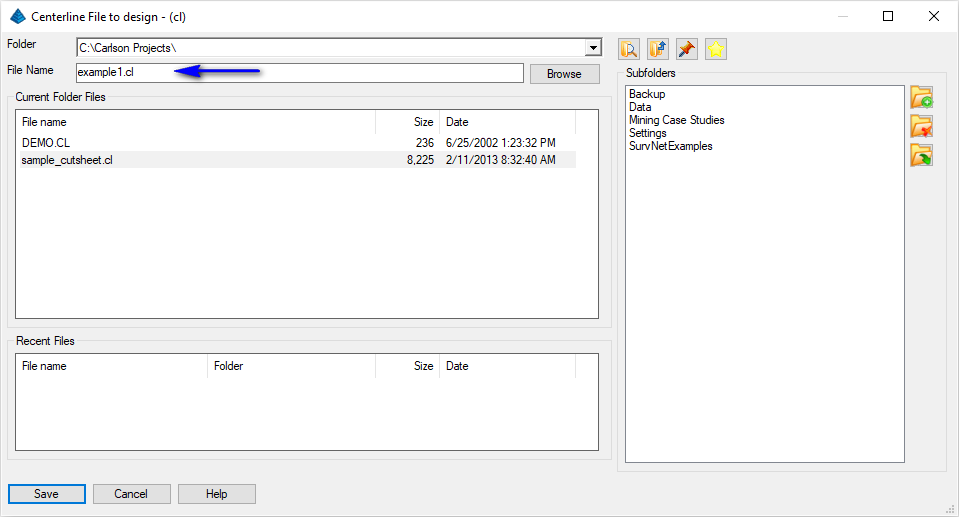 Design Centerline (dialog):
set the values as shown below and click
OK when ready
Design Centerline (dialog):
set the values as shown below and click
OK when ready
 Pick Point or Point number:
type 2016 and press Enter
Pick Point or Point number:
type 2016 and press Enter
Bearing/PI/Exit/Undo/<Pick Point or Point
number>: type 2004 and press
Enter
Bearing/PC/PI/Exit/Undo/<Pick Point or
Point number>: press
Enter
A centerline is generated between the two points.
NOTE: Double-clicking on the polyline on the
screen will open the
Centerline Editor command.
- Our next task will be to establish the cross-section limits
along this corridor centerline. Issue the Sections --
Section Alignment Editor to display a dialog box similar to
that shown below:
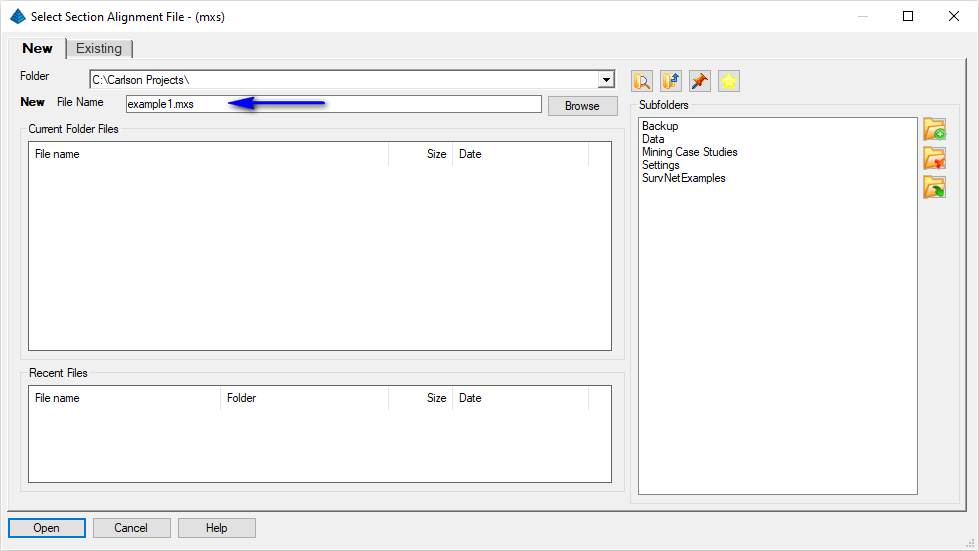
Set the file name as indicated above and click
Open when ready. When prompted:
Polyline should have been drawn in direction
of increasing stations.
CL File/<Select polyline that represents
centerline>: pick the centerline
polyline
Enter Beginning Station of Alignment
<0.00>: press Enter
Section Alignment Settings (dialog):
set the values as shown below and click
OK when ready
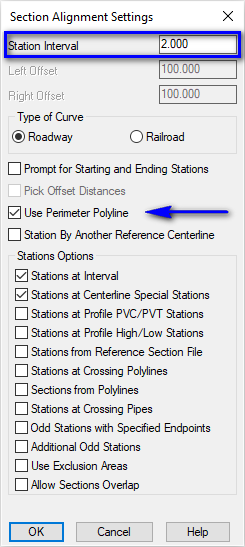
Select boundary polyline: pick the PERIMETER polyline
The program draws temporary lines in the drawing to show the
positions of the sections and displays a summary of the section
alignment as illustrated below:
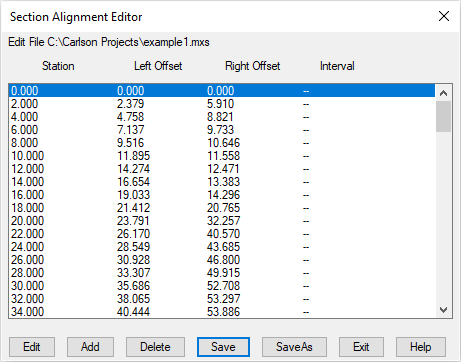
Click the Save button followed by the
Exit button.
- To create the section file for the
Existing (base) surface, issue the Sections -- Create
Sections from... --
Sections from Grid or Triangulation Surface command. When
prompted:
Choose Grid or Triangulation file to Process
(dialog): specify the base.tin created earlier and click
Open when ready
Section Options (dialog): set the option to Prompt and click
OK when ready (with Prompt
specified, you'll be prompted if the Section should change if there
is an underlying change to the source TIN file)
Section Alignment File to Process
(dialog): specify the section alignment
(*.MXS) created earlier and click Open when
ready
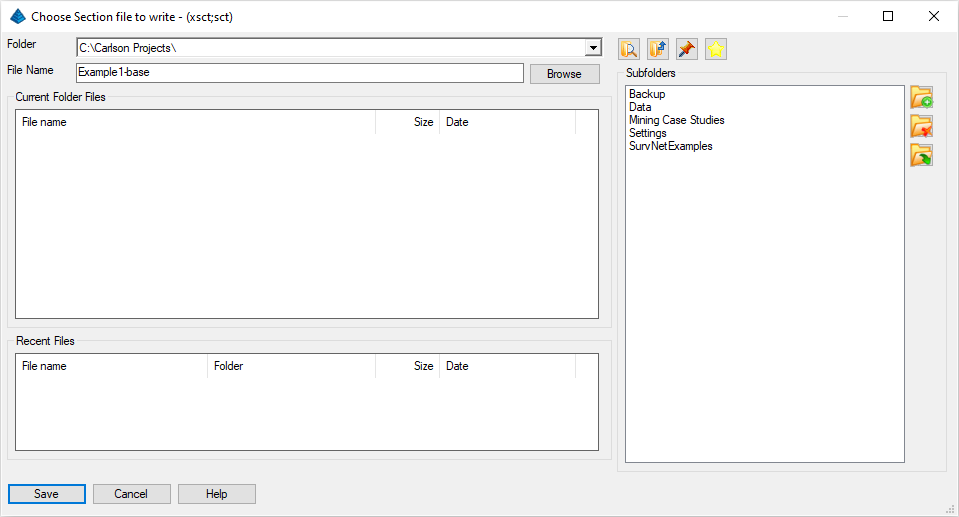
Choose Section File to Write (dialog):
specify a file name as illustrated below and
click Save when ready
The first of two section files is written.
- Let's follow the same general process for the
Final (pile) surface with a few minor adjustments.
Re-issue the Sections -- Create Sections from... --
Sections from Grid or Triangulation Surface
command. When prompted:
Choose Grid or Triangulation file to Process
(dialog): specify the pile.tin created earlier and click
Open when ready
Section Options (dialog): set the option to Prompt and click
OK when ready
Section Alignment File to Process
(dialog): specify the section alignment
(*.MXS) created earlier and click Open when
ready
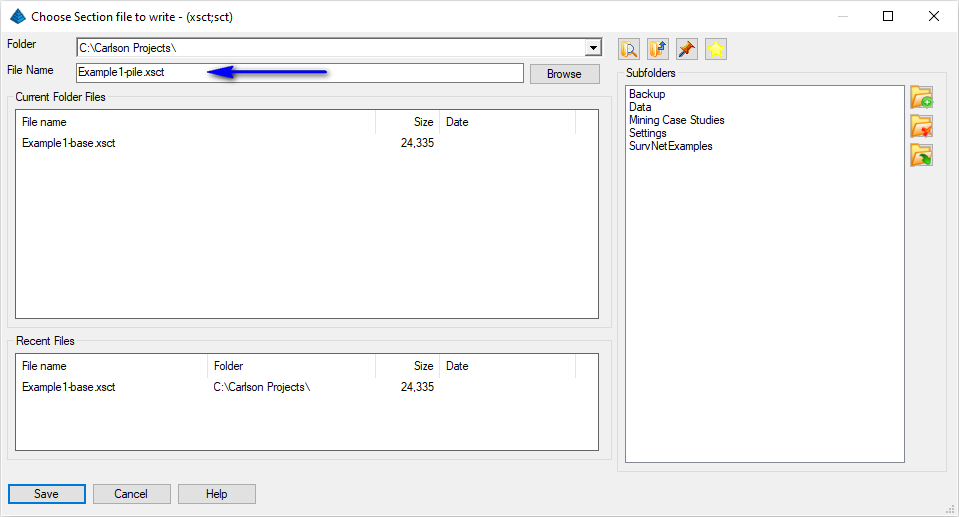
Choose Section File to Write (dialog):
specify a file name as illustrated below and
click Save when ready
The second of two section files is written.
- Optional: Similar to the Check Surfaces (grid) and the Check
Surfaces (TIN) steps discussed earlier, this is an optional
step to check that the section(s) are correct. Issue the Sections
--
Section File Editor command and when
prompted:
Section File to Process (dialog):
select the pile section file
that was just created and click Open when
ready.
A Section File Editor dialog box similar to that shown below
appears:
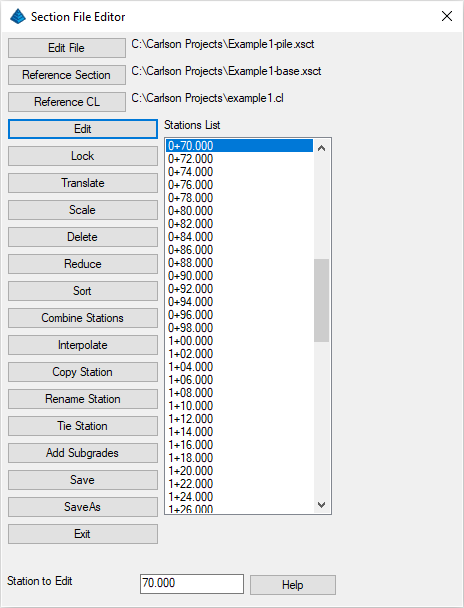
Set the remaining values as shown above. To examine a specific
section, scroll through the list and select a desired station
(e.g. 0+70.00) and click the Edit button
to display a dialog box similar to that shown below:
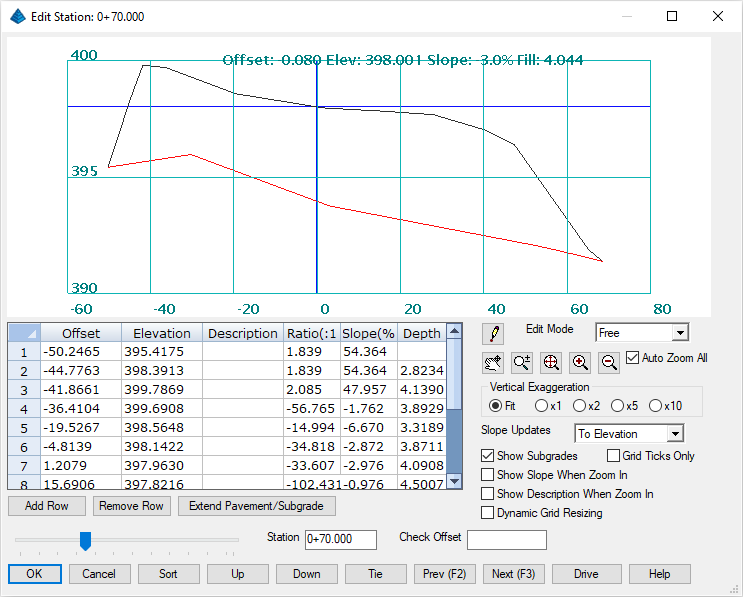
Review the controls in this dialog box and click
OK when ready and then click Exit
on its parent dialog box.
- Now that we have two section files, we can derive the volume
between them. Issue the Sections --
Calculate Section Volumes command. When prompted:
Section File (Existing Ground) to Read
(dialog): select the Base
section file and click Open when
ready
Section File (Final Ground) to Read
(dialog): select the Pile
section file and click Open when
ready
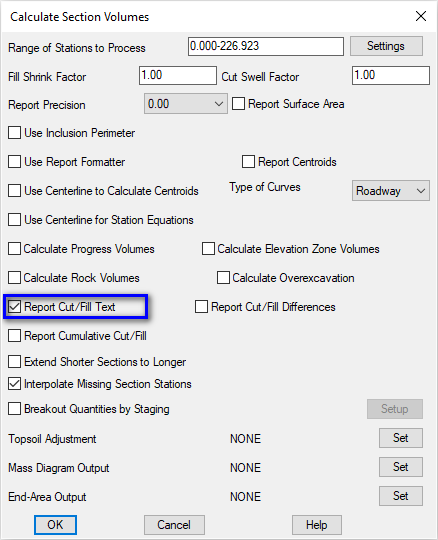
Calculate Section Volumes (dialog):
set the values as shown below and click
OK when ready
The volumes are calculated and reported, along with the cut and
fill end-areas at each station as illustrated below:
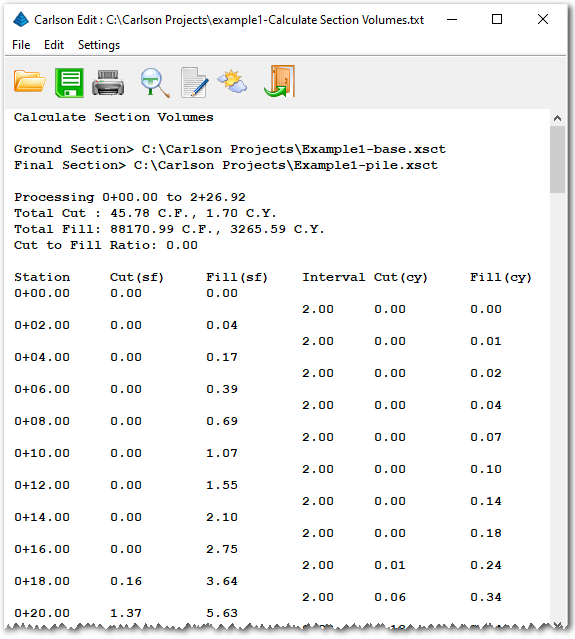
Review the results and click the Exit (Doorway)
button to dismiss the report.
Results Summary
As mentioned earlier, each volume methodology has a particular
use and knowing the application(s) for each method will serve you
well. Here is a summary of our results:
Volume Summary/Comparison
| Method |
Fill (c.y.) |
Cut (c.y.) |
When to use |
| Stockpile Volumes
|
3,264.22 |
- na - |
Quick and approximate Fill-only volumes are sufficient |
| Volumes By Layers
|
3,264.22 |
1.59 |
Quick and for large data sets when approximate Cut and Fill
volumes are sufficient |
| Two Grid Surface Volumes
|
3,264.60 |
1.61 |
Large data sets when approximate Cut and Fill volumes are
sufficient |
| Volumes By Triangulation
|
3,265.55 |
1.70 |
Large or small data sets when precise surface-to-surface Cut
and Fill volumes are needed |
| Calculate Sections Volumes
|
3,265.59 |
1.70 |
Corridor studies where end-area averages are sufficient |
This completes the tutorial: Calculate Volumes By Five
Methods.