- If you get the Start Page, pick Open Files.
- If you get the Startup Wizard dialog box, click the Browse button.
- If you are taken directly into CAD, click File -- Open.
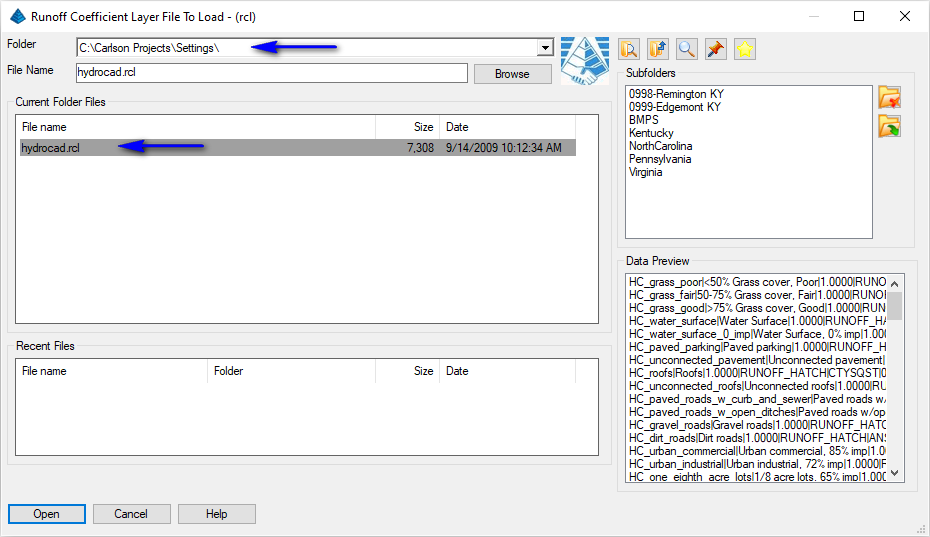
NOTE: If you have a predetermined grouping of watershed layers you wish to preserve, click the Save button to save your previous layers to a named *.RCL file. The step to follow will replace the existing layers with established HydroCAD default layers.
Click the Load button and load the hydrocad.rcl file as shown below and click Open when ready:
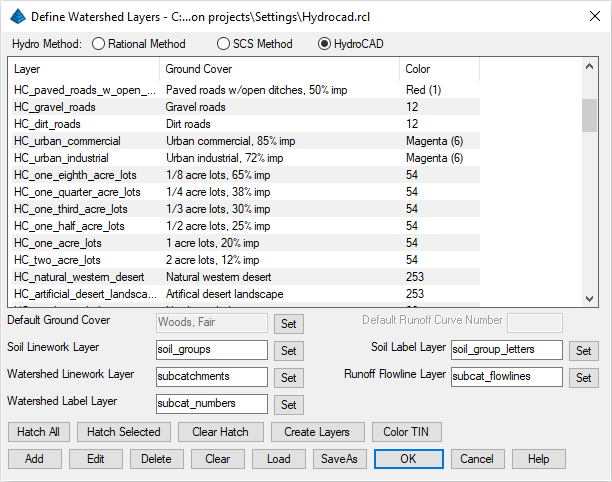
Once loaded, enable the HydroCAD radio button at the top of the dialog box. Any layer names in this dialog box can be changed to whatever you like, but the linework created must use the layers you decide on. A helpful trick is to highlight the layers in the list that you think you will need for the project at hand (using standard Windows Shift+click and/or Ctrl+click functionality) and then click the Create Layers button which would display a dialog box as shown below:
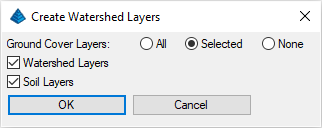
The layers will be created for you thereby eliminating the need to type them all in by hand, and also avoiding typos that will cause the data extraction to fail. Dismiss the Create Watershed Layers dialog box and click the OK button to dismiss the Define Watershed Layers dialog box. Now that the layers are established, you can focus on creating the geometry in the drawing.
- subcatchments
- subcat_numbers
- subcat_flowlines
- longest_flow_paths
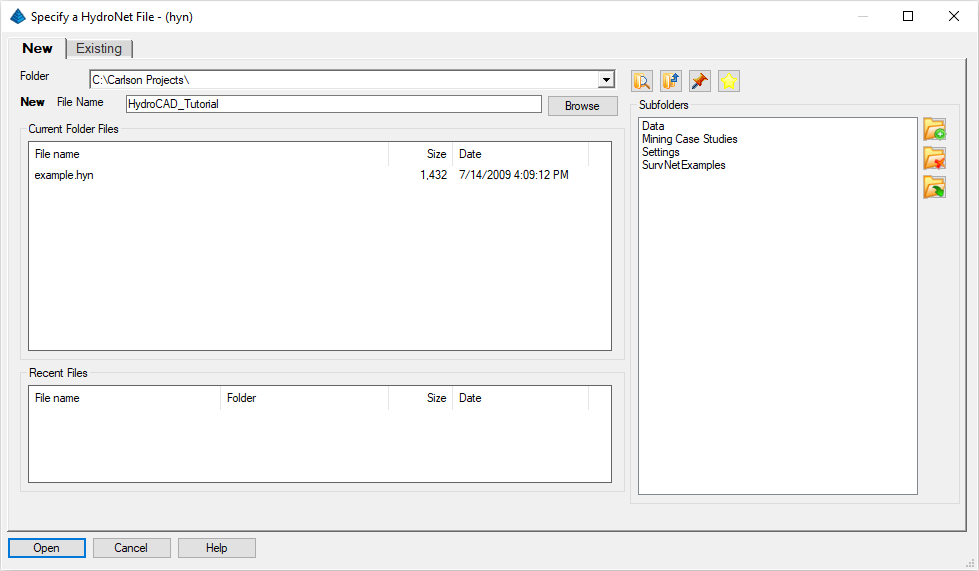
If there is a surface (TIN) for the project site (as there is for this example), Carlson Hydrology can greatly aid in the process of delineating watersheds (subcatchments) and determining the longest flow path for each subcatchment. These tasks are accomplished by issuing the HydroNet -- (or Watershed -- ) Watershed Analysis command. When prompted:
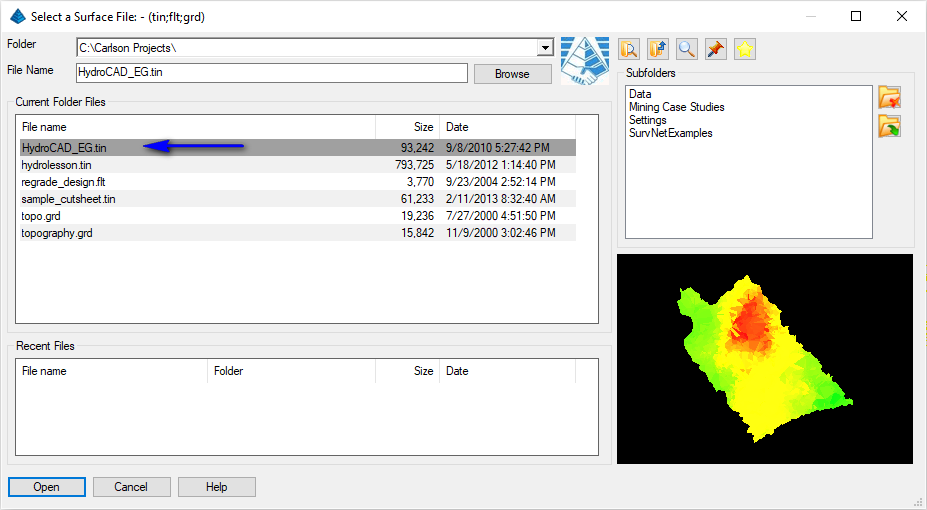
Specify the surface model file as indicated above and click Open when ready. A "docked" dialog box similar to that shown below appears:
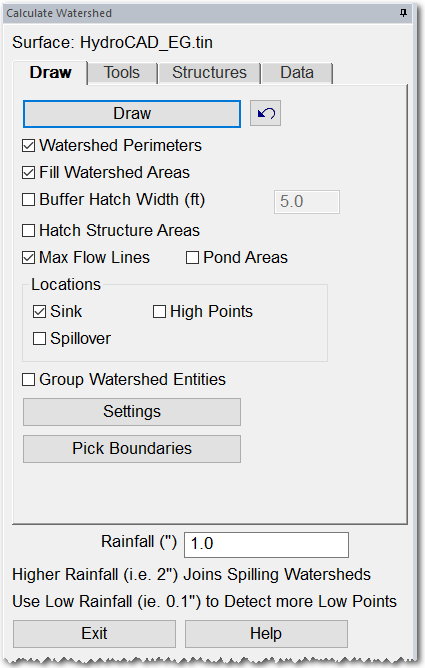
Set the various toggle options as cited above and click the Draw button when ready. The following should be displayed (layers frozen for clarity):
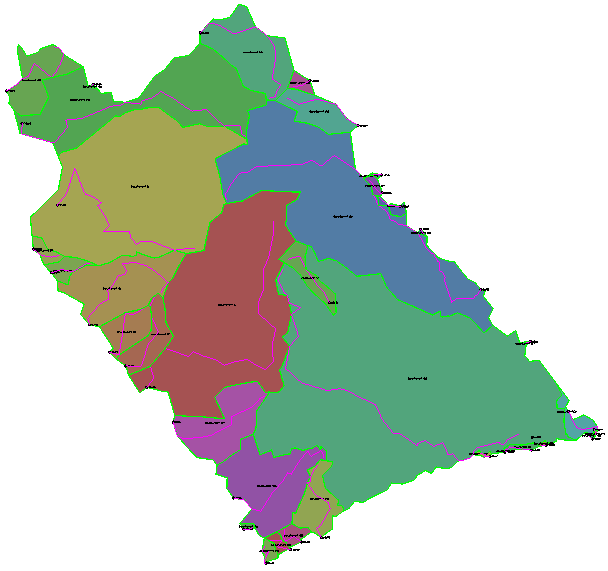
Once the watersheds and max flow lines are drawn, you can make decisions on them:
- Are there too many?
- Are there too few? etc?
Tip: To combine several watershed perimeters into one, use the Draw -- Shrink Wrap Entities command with the Bound method. You would pick the combination of watersheds, and a new boundary would be drawn around them.
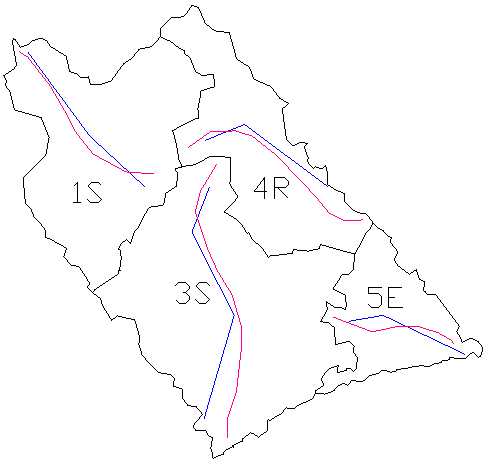
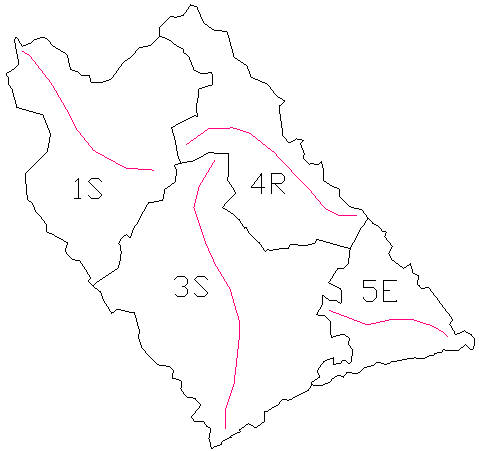
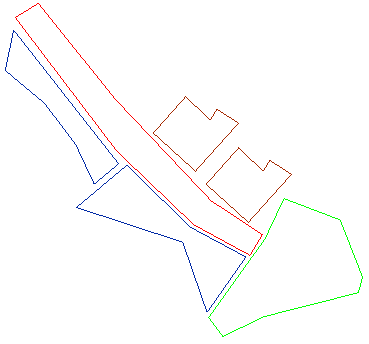
For the purposes of this tutorial, let's use the polyline geometry already established for us. Click the Undo button (next to the Draw button) to remove the Watershed Analysis results from the drawing. Ultimately, you should be left with a closed polyline for each watershed, labeled with a designator and containing a single 3D polyline within each watershed representing the longest flow path as shown below (certain layers frozen for clarity):
Click on the Exit button to dismiss the Watershed Analysis dialog box.
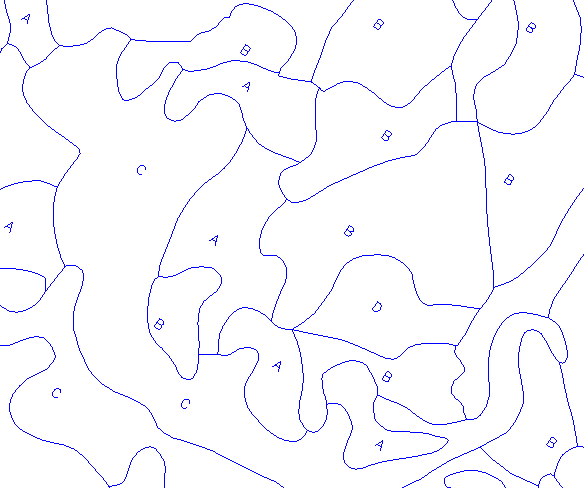
- the soil groups drawn as polylines, all on one layer, and
- the HSG types (A, B, C, or D) labeled within the areas on another single, specific layer.
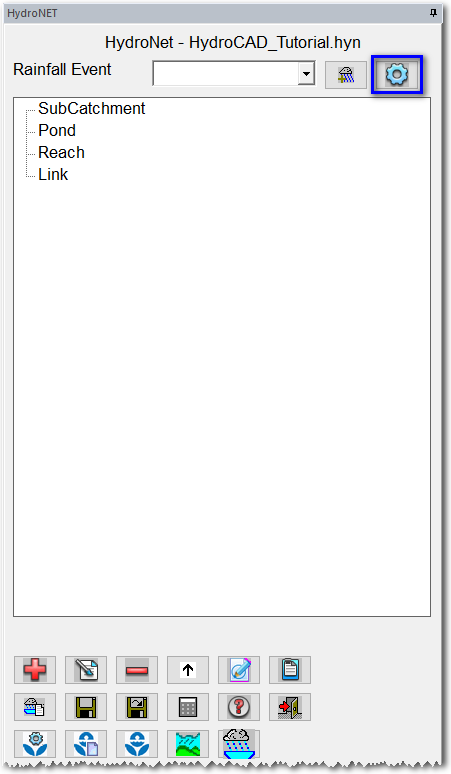
In the resulting "docked" dialog box, pick the Settings (Gear) button as highlighted below:
In the Settings dialog box:
- on the General tab, set the click the
Set to set the Surface File we
used earlier as shown below:
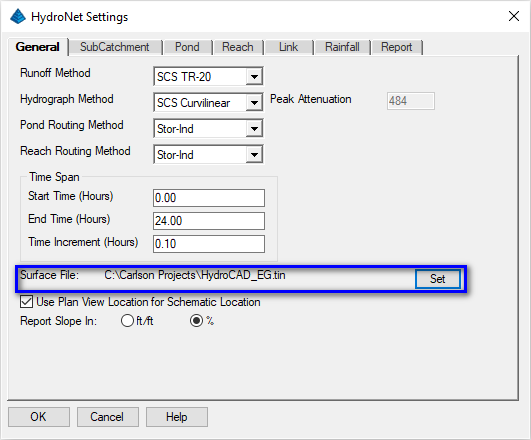
Set the other values as shown. - on the SubCatchment tab, set the
Tc Calculation Method to Curve
Number/Lag as illustrated below:
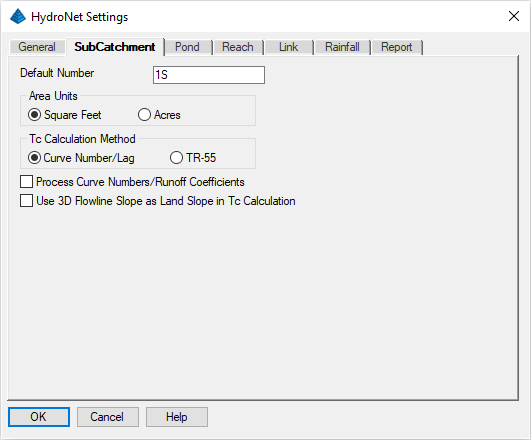
Also, clear the box to Process Curve Numbers/Runoff Coefficients as they will be determined in HydroCAD. - Review the other tabs of settings as found in this dialog box and click OK when ready.
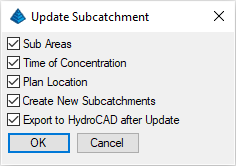
A secondary dialog box appears with the options for the update. Select the options as shown below and click OK when ready:
The subcatchments are listed in the HydroNet Explorer and HydroCAD (if installed), is launched. Double-clicking on any subcatchment name brings up a dialog with its data as shown below:
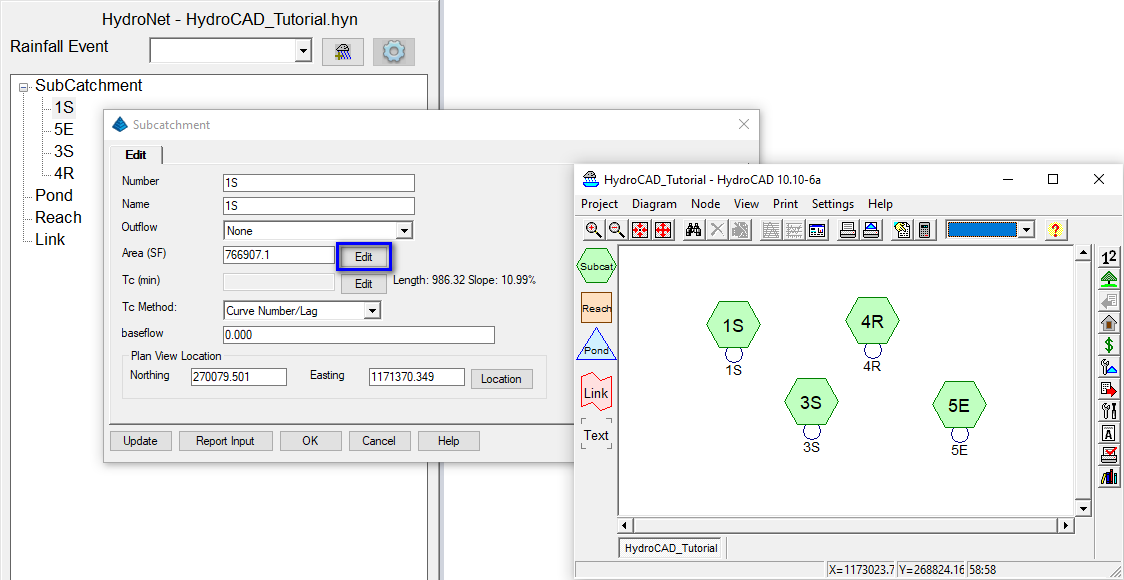
NOTE: The same subcatchments now exist in HydroCAD, ready for any further analysis and/or reporting.
Click the Edit button next to the Area value shows all of the sub-area statistics as illustrated below:
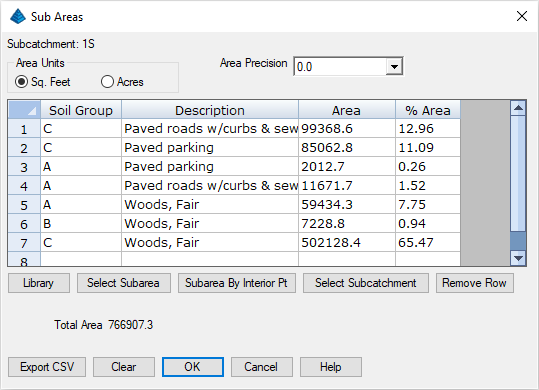
Click OK to dismiss the Sub Areas dialog box and then click OK to dismiss the Subcatchment dialog box to return to the HydroNet Explorer docked dialog box. Click the Exit (Doorway) button to dismiss the HydroNet Explorer docked dialog box.
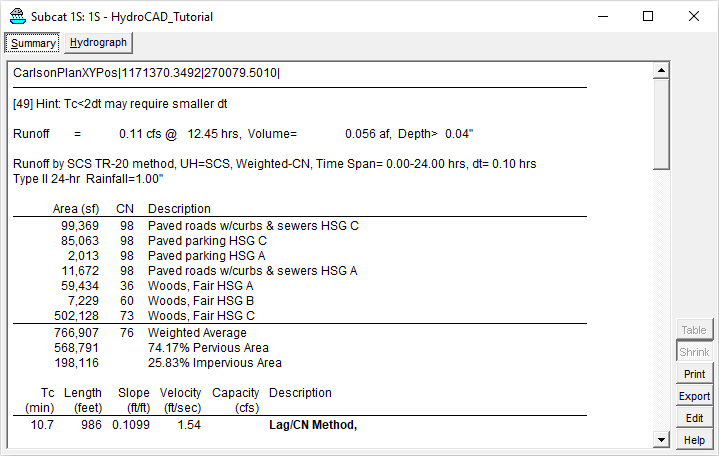
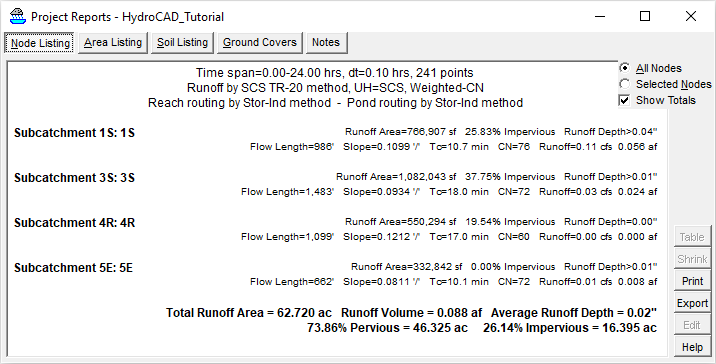
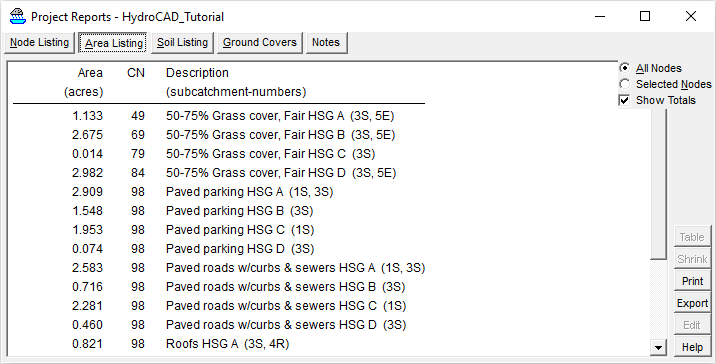
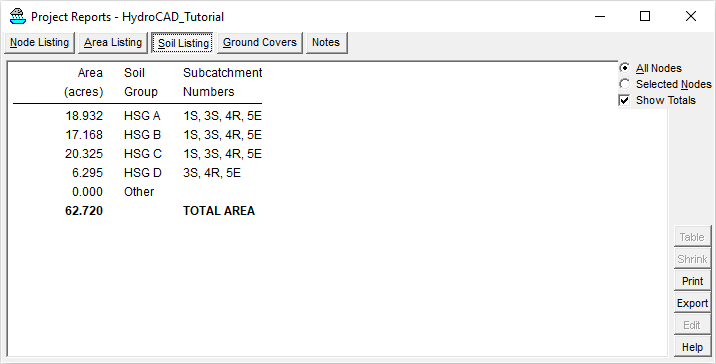
Project reports can also be generated for Nodes, Areas and Soils (among others):
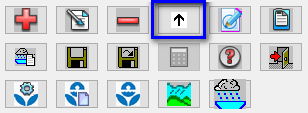
Any changes made in the drawing can instantly update the data in HydroCAD simply by picking the Update button.