 Horizontal Scale: Specify the horizontal scale.
This command generates plots of cross-section data which can be used to further iterate the corridor design or used for construction documentation. The Section files drawn with this command can be created by several methods including the Input-Edit Section File, Digitize Sections, any commands under the Create Sections from... menu, Process Road Design or Road Network commands.
For metric-based projects, please refer to the Drawing Metric Section Sheets section of this document.
The Draw Section File routine will call two primary dialog boxes:
If the Type of Plot option in the Draw Section File dialog box is set to "Sheet," a third Section File Sheet Drafting Parameters dialog will be displayed which provides detailed sheet layout settings.
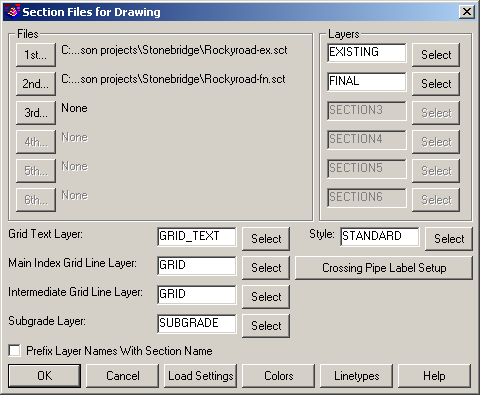
Files: Specify up to six Section (.sct) files to plot and Select a layer for each. To remove a section file entry from the dialog box, click the appropriate 1st, 2nd, 3rd, etc, button which displays the standard File Selector dialog box. Without selecting a file, click the Cancel button from the File Selector dialog box to remove the previously specified file.
Layers: Key-in a desired layer name for each section file or click the Select button to specify a previously established layer.
Key-in a desired layer name or click the Select button to specify a previously established layer for each of the cross-section sheet items:
Prefix Layer Names with Section Name: Enable this option if the layer for each section name is to be prefixed with the Section file name.
Style: Key-in a desired text style or click the Select button to specify a previously established text style that will be assign to all labels.
Crossing Pipe Label Setup: This button opens the Crossing Pipe Label Setup dialog box that allows you to establish settings for drawing and labeling pipes that run along or intersect the cross section alignment.
Load Settings: This option allows you to load the content of a previously saved Section Settings (.sst) file.
Colors: This option allows you assign colors to each of the aforementioned items. The recommended color for each item is ByLayer.
Linetypes: This option allows you assign linetypes to each of the aforementioned items and line widths to each of the section files. The recommended linetype for each item is ByLayer.
 Pipe
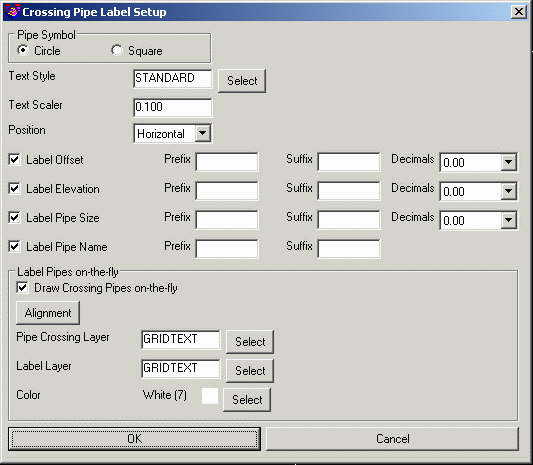
Symbol: Choose whether to show the Pipe
Crossing symbol as a circle or a square. When the sections are
drawn with vertical exaggeration by different horizontal and
vertical scales, then the circles or squares will be stretched into
ellipses or rectangles.
Pipe
Symbol: Choose whether to show the Pipe
Crossing symbol as a circle or a square. When the sections are
drawn with vertical exaggeration by different horizontal and
vertical scales, then the circles or squares will be stretched into
ellipses or rectangles.
Text Style and Text Scaler:
Specify the text style and size of Pipe
Crossing labels.
Position: Chooses between creating
horizontal or vertical labels.
Label Offset, Label Elevation, Label Pipe Size, Label Pipe Name: Enable any or all of these options to label the distance left or right off the alignment (Label Offset), the invert elevation, pipe size and pipe name of each crossing pipe. Use the optional settings for specifying "Prefix" or "Suffix" text and use Decimals to set precision for each label.
Draw Pipe Crossings on-the-fly: Enable this option to have Crossing Pipes that have been created using a Sewer Network file (.sew) or Draw Pipe 3D Polyline command drawn in cross sections. It is not necessary to enable this option if Pipe Crossings have been saved to a Section file (.sct) using the Section Points from Pipes command.
Alignment: Pick this button to select either a Centerline file (.cl) or Section Alignment file (.mxs) to scan for Crossing Pipes.
Layer and Color: These settings specify the layer and color of the Pipe Crossing symbol.
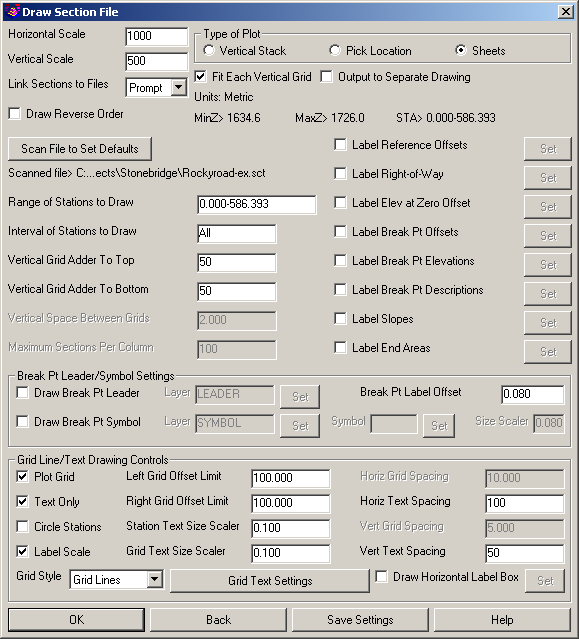
After specifying the Section Files
(.sct) to be drawn and applying settings for each, the Draw Section
File dialog box opens:
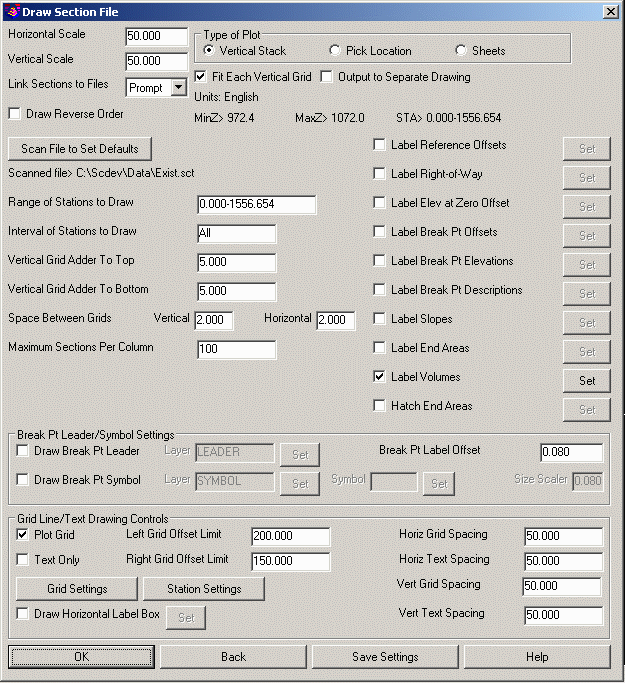
Horizontal Scale: Specify the horizontal scale.
Vertical Scale:
Specify the vertical scale. The
vertical scale relative to the horizontal scale determines the
vertical exaggeration factor.
Link Sections to Files: This setting controls the linkage of the plotted sections to the actual section (.sct) file(s), determining how changes to the file affect the plotted sections.
Type of Plot: Specify how the sections will be plotted:
Fit Each Vertical Grid: When checked, the grid bottom elevation and grid height are set automatically and you may specify values to add to the top and bottom of each grid (see Vertical Grid Adder to Top and Vertical Grid Adder to Bottom). When not checked, you specify the elevation of the grid bottom and the grid height through the Grid Bottom Elevation and Grid Vertical Height controls, respectively.
Output to Separate Drawing: When checked, this option will prompt for a New drawing name and location into which all cross sections will be drawn.
Draw Reverse Order: When checked, this option will draw the cross sections in the order of the highest numbered station to the lowest.
Scan File to Set Defaults: This button allows the program to set the minimum and maximum parameters. If you choose this option, the program will automatically set the range of stations, vertical spacing distance, right and left grid distances and starting/datum elevation. This option writes a file called "sectsort.tmp" that is read and used to set the defaults the next time you use the program. Therefore, if you are selecting a different .SCT file to plot you should use this option to update the .TMP file.
Range of Stations to Draw: Specify the range of stations from the file which will be drawn.
Interval of Stations to Draw: Specify the interval of stations to draw. For example, perhaps you sampled every 25 feet with the Sections from Surface Model command for more accurate quantities but only want to plot 50 foot stations. ALL is the default value for this field.
Vertical Grid Adder to Top: Specify the distance that will be added to the highest elevation of the section for the sheets and pick location options. This option is only available when Fit Each Vertical Grid is checked ON.
Vertical Grid Adder to Bottom: Specify the distance that will be subtracted from the lowest elevation of the section for the sheets and pick location options. This option is only available when Fit Each Vertical Grid is checked ON.
Grid Bottom Elevation: Specify actual bottom elevation for each section grid. This option is only available when Fit Each Vertical Grid is checked OFF.
Vertical Grid Height: Specify actual grid height for each section grid. This option is only available when Fit Each Vertical Grid is checked OFF.
Vertical Space Between Grids: Specify the distance the sections are stacked above the last one plotted when the Vertical Stack option is specified.
Maximum Sections Per Column: Sets the maximum number of sections allowed per column when the Vertical Stack option is specified.
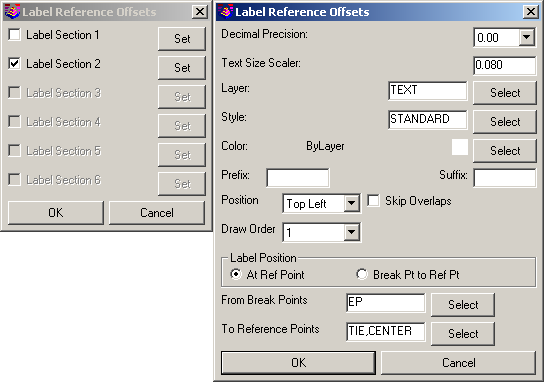
Label Reference Offsets: When enabled, the offset from selected break points of one section file relative to the position(s) of selected points from another section file can be labeled onto the plots.
Label Right of Way: When enabled, this option will label Right of Way points as defined using the Section Points from Right of Way command. Press the Set button to the right of this toggle to set the text size and label offset scalers, layer and text style settings.
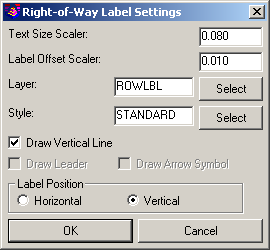
Draw Vertical Line: Places a vertical line, from top to bottom, through the Right-of-Way point.
Draw Leader/Draw Arrow Symbol: When enabled, a short vertical line is drawn, with or without, the arrowhead through the Right-of-Way point.
Label Position: Indicate the desired orientation of the "ROW" text label.
Label Elevation at Zero Offset:
Will label the section elevation at offset
zero. The label is drawn on the section grid just above the section
line. Press the Set button to the right of this
toggle to set the display precision, text size scaler, prefix,
suffix, color and layer for these labels. The Draw Leader option
can be set to None, Diagonal or Vertical.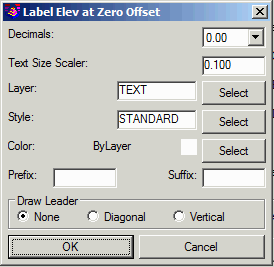 Label
Break Pt Offsets: Will label these
values along the section line above each point in the section.
Press the Set button to the right of this toggle
to set the display precision, text size scaler and layer for these
labels.
Label
Break Pt Offsets: Will label these
values along the section line above each point in the section.
Press the Set button to the right of this toggle
to set the display precision, text size scaler and layer for these
labels.

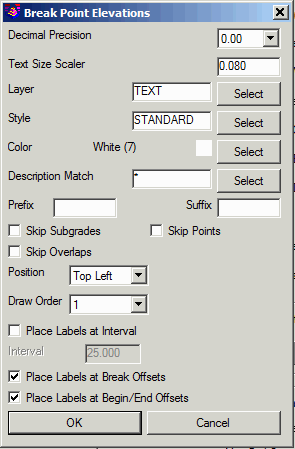
Label Break Pt Elevations: Will label these values along the section line above each point in the section. Press the Set button to the right of this toggle to set the display precision, text size scaler, style, color, prefix, suffix, position and layer for these labels. The Description Match is a way to filter which section points to label.
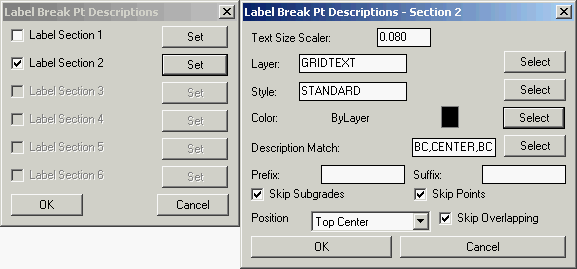
Label Break Pt Descriptions: Will label these values along the section line above each point in the section. Press the Set button to the right of this toggle to set the text size scaler, layer, and description match for these labels.
Label Slopes: Will label cross-slope values of the Section. Press the Set button to the right of this toggle to set the text and symbol size scaler, layer, and label format for these labels. Enable the Label Relative to Zero Offset option to ensure slopes are measured from the zero offset line out to the extents of the Section. Also, if you do not want all slopes on the Section labeled, you can use the "Label From" and "to" settings to specify Section point descriptions to label between. For instance, you could specify to only label the slope between the SW (sidewalk) and SH (shoulder) ID points as defined in the Template file (.tpl) that was used to generate your Section file (.sct).

Label End Areas: Will label cut and fill end areas on each section. The Use Table option will create a table of the cut/fill values on each section.
 Label Volumes: Will label cut
and fill volumes on each section. The volumes are measured between
the current station and previous station. There are settings to
control the format and placement of the labels.
Label Volumes: Will label cut
and fill volumes on each section. The volumes are measured between
the current station and previous station. There are settings to
control the format and placement of the labels.
Hatch End Areas: This option hatches the cut/fill areas between the first
and second section files. The program treats the first section as
existing and the second as design for determining cut verses fill.
There are separate hatch pattern, color and scale settings for cut
and fill. Draw Break Pt Leader: Enable
this option to include a leader with the Label Break Pt Offsets, Label Break Pt Elevations or Label Break Pt Descriptions options. Click
the Set button to specify the desired layer for
the leader.
Draw Break Pt Leader: Enable
this option to include a leader with the Label Break Pt Offsets, Label Break Pt Elevations or Label Break Pt Descriptions options. Click
the Set button to specify the desired layer for
the leader.
Draw Break Pt Symbol: Enable this option to include a symbol with the Label Break Pt Offsets, Label Break Pt Elevations or Label Break Pt Descriptions options. Click the Set button (to the immediate right of the Layer control) to specify the desired layer for the symbol. Click the Set button (to the immediate right of the Symbol control) to specify the desired symbol and indicated the desired Size Scalar.
Break Pt Label Offset: Indicate the desired offset amount from the surface break point to its label.
Plot Grid: Uncheck this toggle if you do not want the grid to plot.
Text Only: Check this toggle if you only want to plot the cross
section polyline and the grid text. This can be useful for plotting
on a section sheet that has pre-plotted grid lines and you want to
plot only the section and text.
The Station Settings button displays another dialog for the station label settings including decimal places, size, layer, style, color, prefix, suffix, format type and position. The Circle Station option will draw a circle around the station label.
 Label
Scale: Will label the horizontal and
vertical scale with the first section on each sheet.
Label
Scale: Will label the horizontal and
vertical scale with the first section on each sheet.
Left Grid Offset Limit: Specify the length the grid lines are plotted to the left from the centerline or zero offset.
Right Grid Offset Limit: Specify the length the grid lines are plotted to the right from the centerline or zero offset.
Station Text Size Scaler: Specify the text size scaler for the station text. This value is multiplied by the horizontal scale to obtain the final text height. For example, if you set Station Text Size to 0.10 and the horizontal scale is 100.0, then the text height will be (0.10 * 100) or 10.0.
Grid Text Size Scaler: Specify the text size scaler for the axis text. This value is multiplied by the horizontal scale to obtain the final text height. For example, if you set Axis Text Size to 0.08 and the horizontal scale is 50.0, then the text height will be (0.08 * 50) or 4.0.
Horiz Grid Spacing: Specify the distance the vertical lines of the grid will be spaced.
Horiz Text Spacing: Specify the interval that text will be plotted below the grid lines.
Vert Grid Spacing: Specify the distance the horizontal lines of the grid will be spaced.
Vert Text Spacing: Specify the interval that text will be plotted to the left and right of the grid lines.
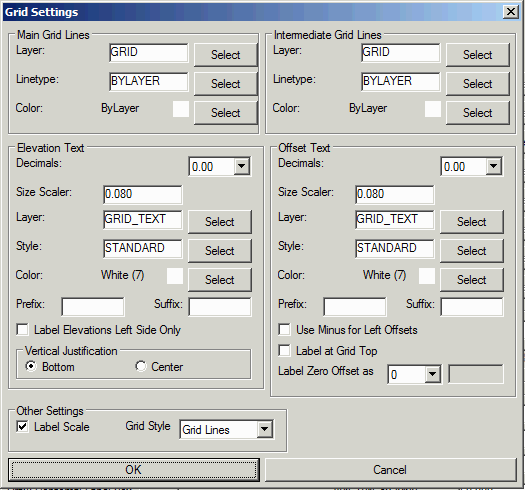
Grid Settings: Click this button to establish how text annotation is configured for the grid. There are setting for the grid lines and text for layer, linetype, color, decimals, style, size, prefix and suffix. Label Elevations Left Side Only: Enable this option if elevation labels are desired only on the left side of each section. Use Minus for Left Offsets: Enabling this option will show a minus sign (-) in front of all left offset distances. Label Zero Offset as: Use this setting to label the Zero Offset as "0", "C/L" or "Other" to specify a custom label. Grid Style: When using either the Vertical Stack option or the Pick Location option, indicate the desired style for the grid markings.

In the Draw Horizontal Label Box dialog, select from the Available Fields in the list on the left to populate the list of Used Fields on the right side. Once an item has been moved to the list of Used Fields, you can double-click on the Field to change settings and format for each Field. An example of the Elevation Difference option is shown below:

The Row Title for each field can be edited from the default to show a descriptive title. The DZ value in the Elevation Difference settings dialog allows you to specify which Section's elevations are to be subtracted from the other. This setting is critical to return the correct cut and fill depth values. In all field settings boxes, you have the ability to skip surface points in order to make the data more legible.
Skip Subgrades: Enable this option to skip all subgrades as may have been defined in Design Template files (.tpl).
Skip Points: Enable this option to skip points in the Section file (.sct) that were created using any of the Create Section Points... commands.
Skip Overlaps: Enabling this option will cause any overlapping text in the table to be skipped. Having this option enabled will disable the Shift Overlaps option.
Shift Overlaps: Enabling this option will shift any text in the table to the right so that it does not overlap preceding text.
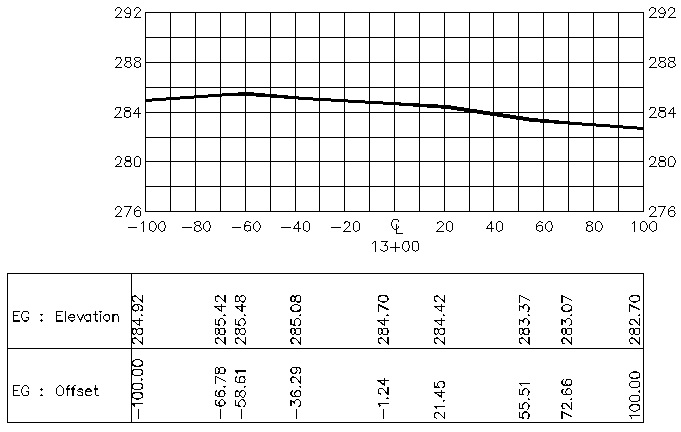
A sample cross-section with Horizontal Label Box is shown below:
Select the OK button to continue. If the Vertical Stack option was selected, the sections are immediately drawn to the active "space" (e.g. the Model or Layout) with the bottom center of the first section getting placed at 0,0. If the Pick Location option was specified, you will be prompted to specify the base location for each section. If the Sheets option was selected, the Sheet Drafting Parameters dialog box appears allowing you to specify all the settings for sheet plotting.
Section File Sheet Drafting Parameters
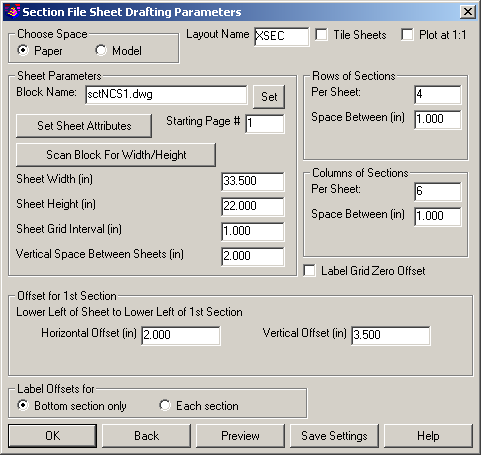
Choose Space: Indicate whether sheets are to be drawn to Paper Space (also known as a Layout) or to Model Space.
Layout Name: Indicate the name of the layout to which the first sheet should be drawn.
Tile Sheets: Enabling this option places all sheets in the specified Layout Name. The result is a vertical stack of sheets in the layout. Disabling this option allows additional layouts to be created each containing one sheet. As additional layouts are created, the name of each successive layout is incremented by a value of 1.
Plot at 1:1: Enabling this option draws the sections so that one unit horizontally in the section is equivalent to one plotted unit. The ratio of the Horizontal Scale:Vertical Scale determines the amount of vertical exaggeration.
Block Name: Specify the drawing name that will be inserted for each sheet. The default is SCTSHT1 which is included with Carlson Software and is located in the %AppData%\Carlson Software\...\Sup\ folder. You can use this or use a sheet block of your own design. The block should be drawn at a 1:1 scale since the program inserts it using the Horizontal Scale setting from the previous dialog. Click the Set button to browse/navigate to an alternate drawing file.
Set Sheet Attributes: For grid sheet block names that utilize attributes (useful for items such as sheet numbers, drawn date, drawn by, job name, etc), use this command to provide attribute values that will be placed for each sheet block:
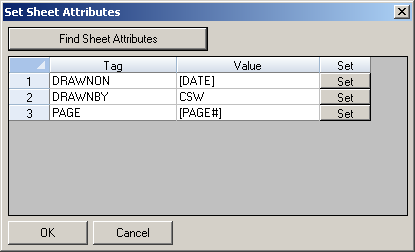
Find Sheet Attributes: This routine will scan the Block Name for any attribute definitions and return them to the dialog box so values can be established for each attribute.
Starting Page #: Indicate the starting page number to be applied to the plots through the use of the Set Sheet Attributes command.
Scan Block for Width/Height: Use this routine to scan the specified Block Name for its width and height. These values are populated into the Sheet Width and Sheet Height controls.
Sheet Grid Interval: Indicate the spacing between the grid lines in the sheet block. The routine will not draw the grid lines and uses this information to control the placement of each section onto the sheet.
Vertical Space Between Sheets: Indicate the amount of space that should be placed between sheets when the Tile Sheets option is enabled.
Rows of Sections
Per Sheet: Specify
the maximum number of sections that can be stacked on top of each
other on a sheet.
Space Between: Specify how much space will be placed between the top of
the last section plotted and the bottom of the next section. For
U.S. Customary based units, a value of 1 would be a good starting
value.
Columns of Sections
Per Sheet: Specify
how many columns of sections can be placed on each
sheet.
Space Between: Specify the distance between the left edge of one section
column edge and the right edge of the next column. This will
generally be the area where elevation labels and station circle
annotation will be placed. For U.S. Customary based units, a value
of 2 would be a good starting value.
Label Grid Zero Offset: Enable this toggle if the zero offset location of each section should be labeled on each section.
Offset for 1st Section
Horizontal Offset: Specify how far from left edge of the sheet the first
section will be placed on to the section sheet. The block SCTSHT1
has a 1" left margin.
Vertical Offset: Specify how far from bottom edge of the sheet the first
section will be placed on to the section sheet. The block SCTSHT1
has a 1/2" bottom margin.
Preview: This button allows you to get an approximate idea of what the initial sheet will look like based on the current settings.
Back: This button allows you to return focus to the main dialog and make changes to any previous settings or cancel the routine.
Save Settings: This button allows you to save all the parameters settings to a file so you can easily recall them for another project.
If the Pick Location option was specified, the program scans the station data and determines the minimum and maximum elevations, and proposes a datum elevation. If you have pre-plotted a grid sheet and want to reference another local grid coordinate, then change the datum elevation appropriately. The Pick Location type of plotting has the following prompts:
Station> 25.000 Min Elev> 1055.301 Max Elev> 1057.068
Change datum elev/<Select point that represents 0 offset elev
1050.0>: Pick a point
Station> 50.000 Min Elev> 1055.557 Max Elev> 1057.324
Change datum elev/<Select point that represents 0 offset elev
1050.0>: Pick a point
The program continues to prompt until the last station in the range specified is drawn. You can use the Cancel function (the Esc key) to stop plotting, if necessary.
If the Sheets option was specified with Model space as the destination, you can choose where to insert the sheet(s):
Select Starting Point for Row of Sheets <0.0,0.0>: Pick a point or press Enter to accept the default value specified
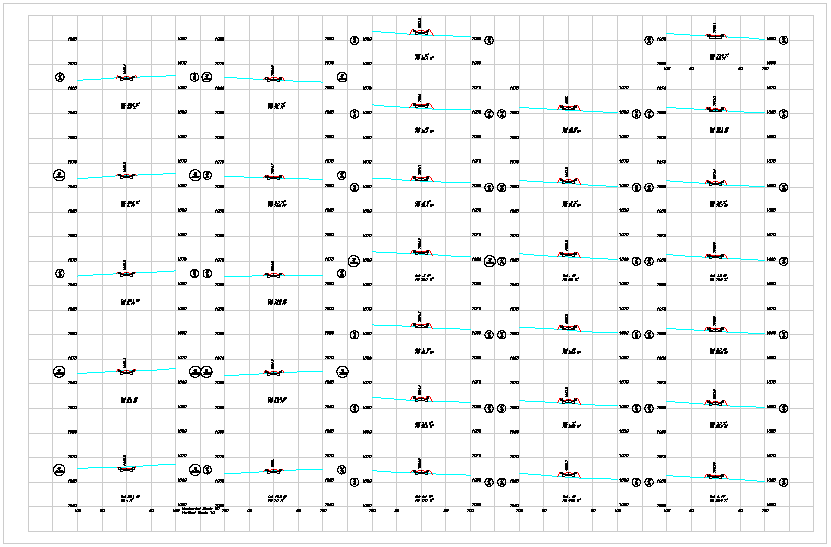
Sheet Sample
First, be sure that you are set to metric mode in Drawing Setup under the Settings menu. For our example, assume a 1:1000 horizontal scale. Once set, issue the Draw Section File command and click OK to reach the second dialog. There is a different block name for metric sections called schsht2.dwg which is located in the %AppData%\Carlson Software\...\Sup\ folder. Begin by setting the parameters for the second dialog as shown.
Second dialog with metric settings

Third dialog with metric settings
Adjust settings as needed to achieve the desired look/layout.
Pulldown Menu Location(s):
Civil > Sections, Field >
Roads
Keyboard Command: drawsct
Prerequisite: A Section (.sct) file