- If you get the Start Page, pick Open Files.
- If you get the Startup Wizard dialog box, click the Browse button.
- If you are taken directly into CAD, click File -- Open.
- design contours
- elevated pad perimeter polylines
- spot elevations
- 3D polylines for the road centerlines and face of curbs
| Triangulate Tab | Contour Tab |
|---|---|
|

|
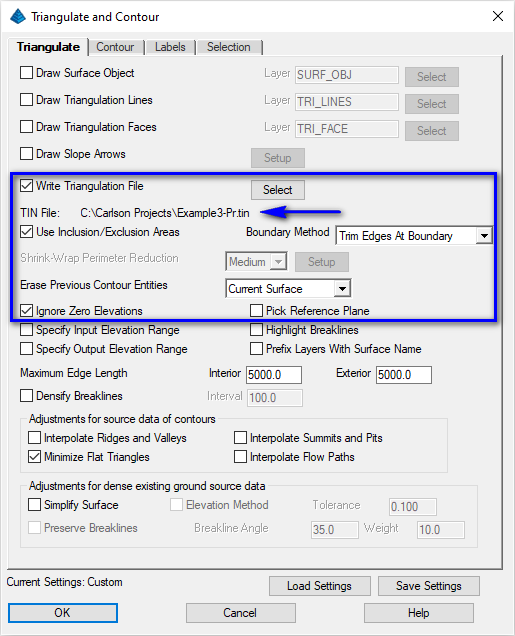
NOTE: Use the Select button on the Triangulate to create an output TIN file as illustrated above.
Once set, click the OK button and when prompted:
Select Inclusion perimeter polylines or ENTER for none.
[FILter]/<Select entities>: pick the perimeter polyline
[FILter]/<Select entities>: press Enter
Select Exclusion perimeter polylines or ENTER for none.
[FILter]/<Select entities>: press Enter
Select points and breaklines to Triangulate.
[FILter]/<Select entities>: type ALL and press Enter twice
The surface model *.TIN file is created.
Select Surface File (dialog): pick the TIN file created in the previous step and click Open
A display similar to that shown below appears:
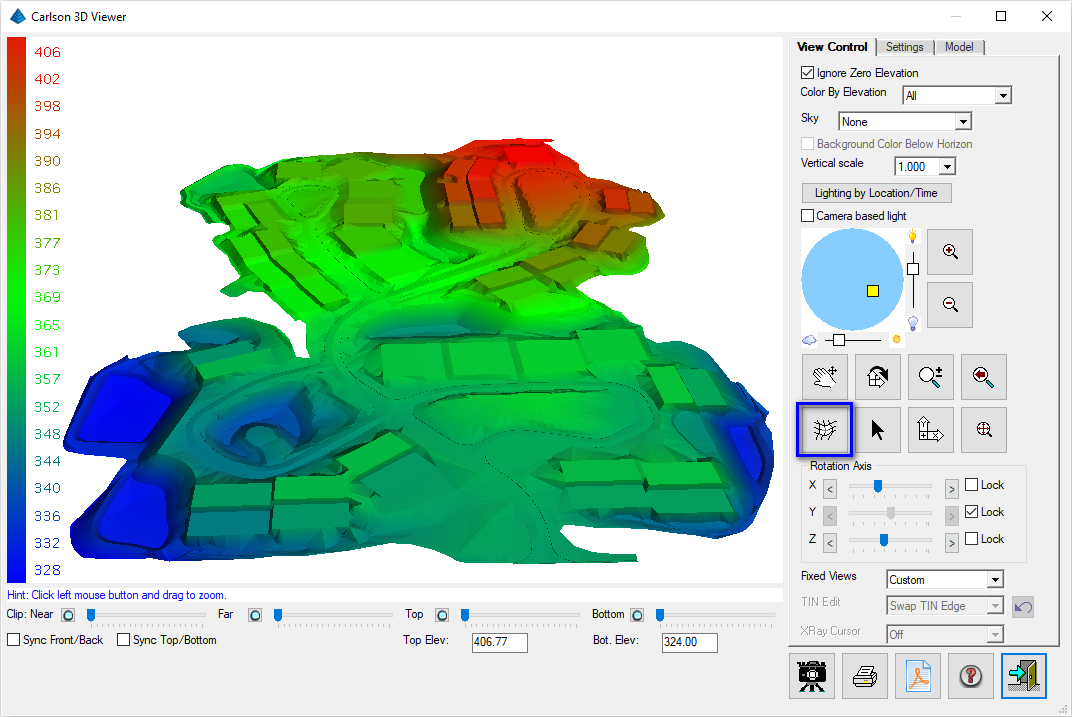
NOTE: In the 3D Viewer dialog, move the pointer near the outer edge of the graphic and the cursor will change to an Z symbol which orients the view about the vertical axis. Moving the cursor to the interior of the graphic and the cursor will change to an X/Y symbol. Click and drag from the bottom upward to change the isometric viewing angle. You can also set the Vertical Scale to 2.0 and enable the Color By Elevation toggle for better viewing of the elevation difference and the Surface Shading toggle (highlighted above) can be used to shade/unshade the surface. Experiment with any desired remaining options.
The surface looks correct in the 3D Viewer. The site has a slope from the top road circle down towards the detention ponds at the bottom. When ready, click the Exit (Doorway) button.
- Q is flow
- C is a runoff coefficient
- i is rainfall intensity
- A is area
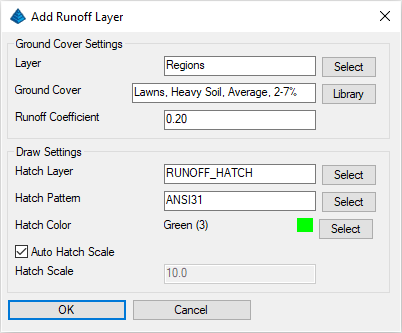
- site perimeter polyline is on the Regions layer
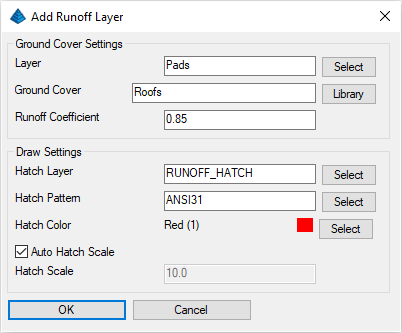
- building pads are on the Pads layer
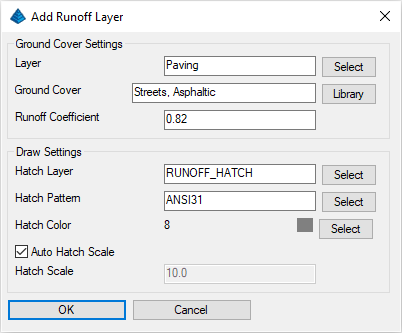
- edge of pavement polylines are on the Paving layer
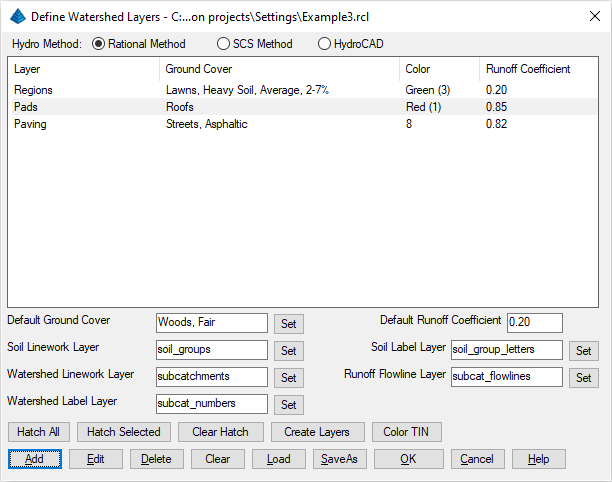
Begin with an empty dialog by clicking the Clear button to delete any existing layers from the table. Click the Add button and use the Runoff Summary information below for each of the specified layers:
| Regions Layer | Pads Layer | Paving Layer |
|---|---|---|
|
|
|
- Click the Select button associated with Layer to set each layer
- Click the Library button associated with Ground Cover to set the associated ground cover
- Click the Select button associated with Hatch Color to set the color for each layer ground cover
- Click OK to save each item
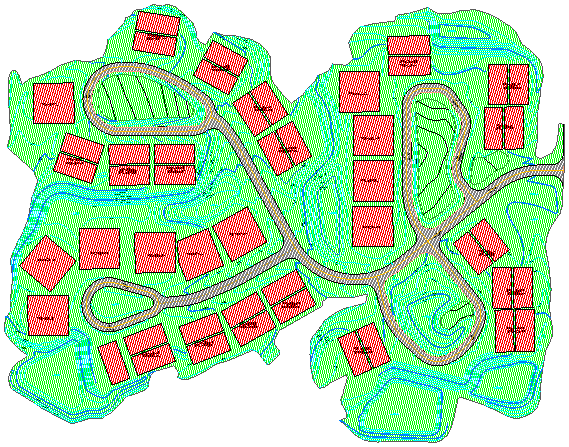
NOTE: The areas within the buildings are inside both the Regions and Pads polylines and the Pads govern because they are the smaller area. Likewise the road areas are governed by the Paving layer and road interior islands are not counted for Paving because the interior Paving polylines act as an exclusion perimeters. The rest of the area is set to the Regions layer.
We don't need to keep the runoff hatches. Remove them by clicking the Clear Hatch button and click OK when ready to dismiss the main dialog box (save the configuration using the file name shown in the top of the image cited earlier).
Select Surface File (dialog): pick the TIN file created in the previous step and click Open
A "docked" dialog box similar to that appears:
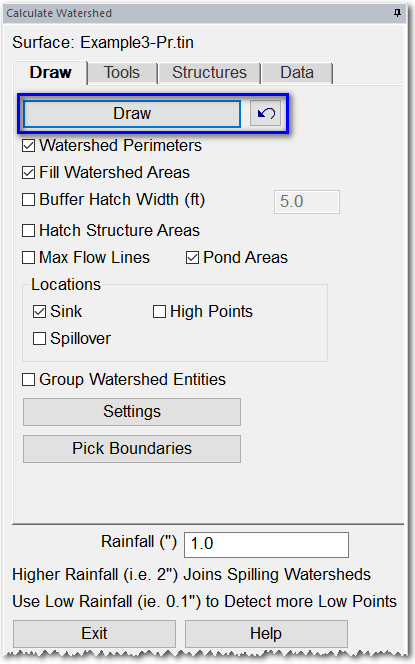
On the Draw tab, enable the toggles for:
- Watershed Perimeters
- Fill Watershed Areas
- Sink Locations (low points)
- Pond Areas
NOTE: The program uses the runoff volume calculated from the rainfall depth and drainage areas to figure when the runoff is enough for the flow to go through a low point. If the Rainfall Depth is set to zero, then the flow lines will stop at every low point or dimple in the surface. At this point, we have not defined our storm event to know the actual rainfall depth. If we did get the storm rainfall depth, we could enter it. For now we're just using Watershed Analysis to give a general idea of the watershed areas and runoff flow lines.
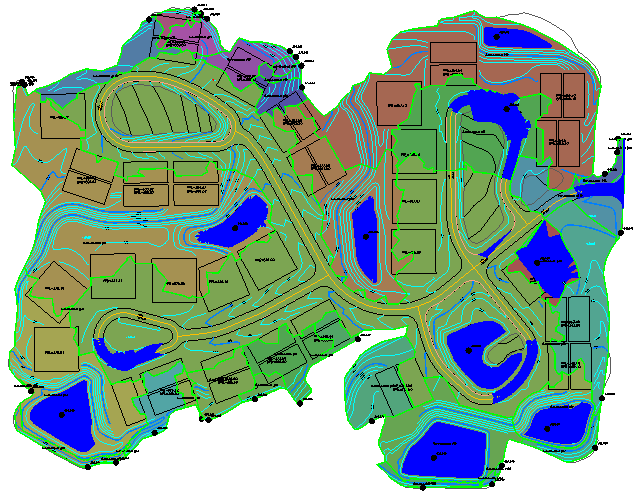
Click the Draw button. Each watershed area is drawn with a closed polyline and solid filled with different colors. Also, for each watershed the sink (lowest point) is drawn with a solid circle symbol. The areas covered by ponding are drawn as solid blue hatches. The depth and size of the pond areas is determined by the runoff volume. In many places, the pond areas are inside the detention pond structures. In a few places, the ponds are at low points in the road which indicate areas that we need to add storm sewer inlets:
When you are done inspecting the watersheds, click the Undo arrow next to the Draw button (as illustrated earlier) to erase all the watershed entities.
Next, activate the Tools tab as illustrated below:
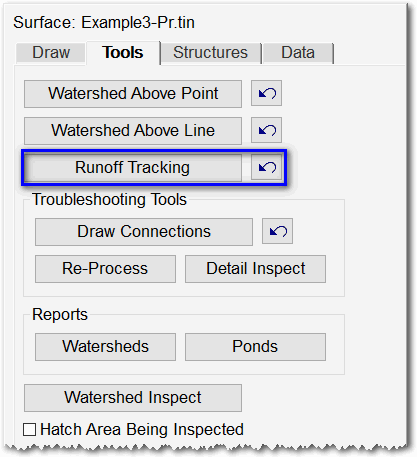
Click the Runoff Tracking button to display a dialog box similar to that shown below:
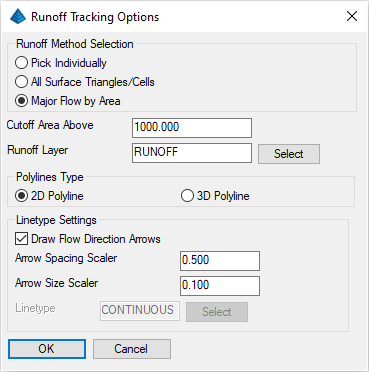
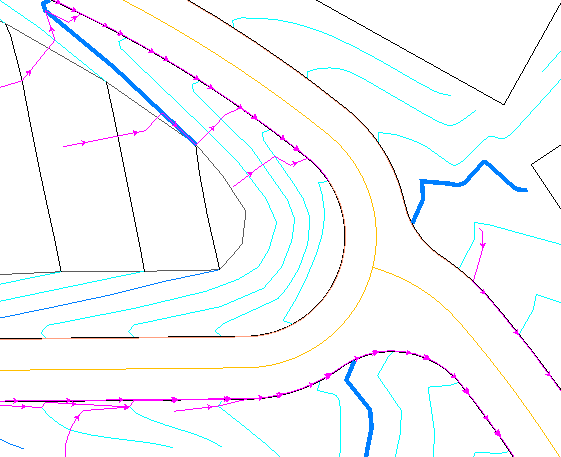
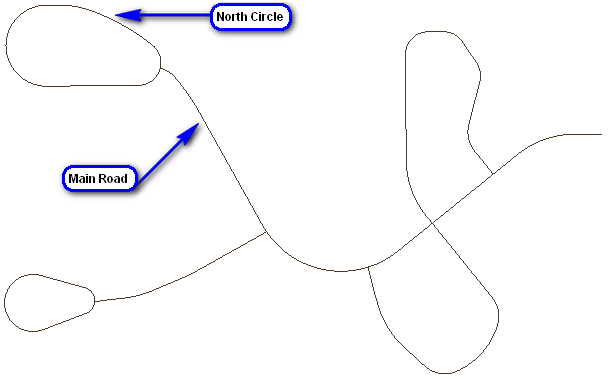
Set the values as shown above to draw flow lines only when the drainage area for the flow line is greater than the specified area and click OK when ready. The graphic below shows the flow lines coming off the road circle at the top of the site and following the curbs. We're going to leave the runoff flow lines on the drawing to help guide the placement of inlets.
Click Exit to end Watershed Analysis.
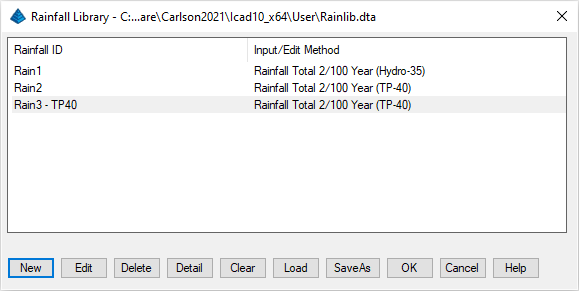
This command keeps a list of different storm events that you can use for different locations and requirements. Let's add a storm by clicking the New button. There are numerous types of rainfall definitions:
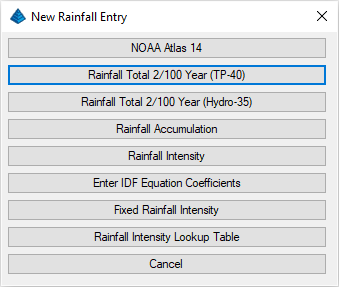
For this example, select the Rainfall Total 2/100 Year (TP-40) method to display a dialog box similar to that shown below:
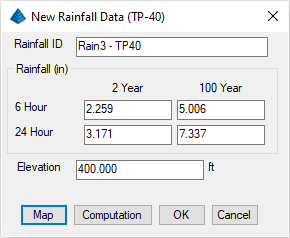
Within the dialog box, supply the rainfall name as shown above and either:
- Use the Map button to show the TP-40 rainfall
maps for the different storms. And if you pick on the map display,
the program will interpolate the rainfall from the maps. In this
case, south central CT was picked:
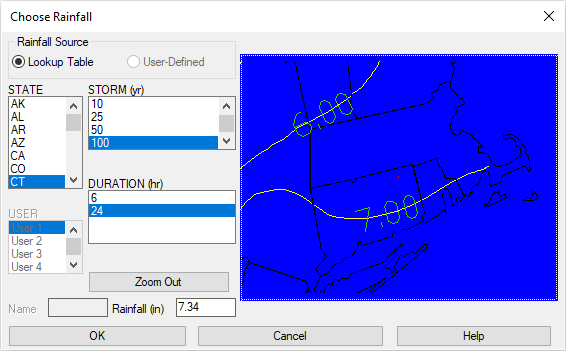
- Supply the rainfall amounts for the 2 and 100 year storms for 6 and 24 hours, and the Average Elevation for the site.
Centerline File to Write (dialog): supply a name of North.cl and click Save
Polyline should have been drawn in the direction of increasing stations.
Select polyline that represents centerline: pick the road centerline for the loop road at the top of the site as illustrated below
Centerline station [Reverse/Ending/<Beginning: 0+00>]: press Enter
Press ENTER to continue. press Enter
 A centerline file
is created. Immediately press Enter to re-run the Polyline
To Centerline File command and when prompted:
A centerline file
is created. Immediately press Enter to re-run the Polyline
To Centerline File command and when prompted:Centerline File to Write (dialog): supply a name of Main.cl and click Save
Polyline should have been drawn in the direction of increasing stations.
Select polyline that represents centerline: pick the road centerline for the main road as illustrated above
Centerline station [Reverse/Ending/<Beginning: 0+00>]: press Enter
Press ENTER to continue. press Enter
Activate the Hydrology menu via Settings -- Carlson Menus -- Hydrology Menu.
Set the filename as shown above and click Open when ready. The sewer network also works with a current surface model that is used for the default rim elevations, reporting pipe cover and calculating inlet drainage areas. To set the current surface, issue the Network -- Sewer Network Setup -- Set Surface File and when prompted:
Surface Model to Reference (dialog): pick the TIN file created earlier and click Open
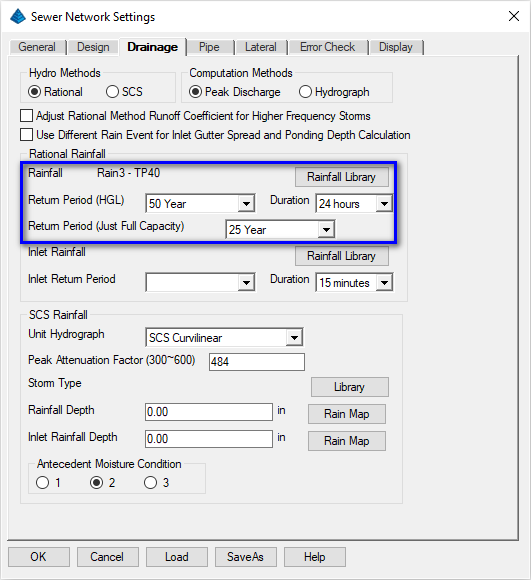
Additionally, issue the Network -- Sewer Network Settings command to display a dialog box similar to that shown below. Click the Drainage and the click the Library to set the Rainfall to the data created earlier and specify a Return Period of 100 years as illustrated below:
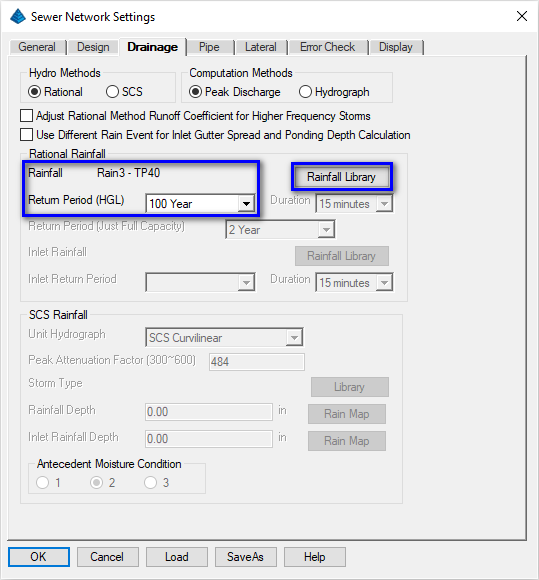
Review the content of the other tabs and click the OK button when ready.
Now we're ready to lay out the inlets and pipes. Let's work on the drainage for the roads of the North loop and the Main road and run this flow to an outlet in the central pond. Issue the Network -- Create Sewer Structure command and when prompted:
Locate by pick point, point number or station-offset [<Pick>/Number/CL/Curb]? press Enter
Pick structure location: zoom in very close so that you can see the curb line and pick a location on the inner curb line
NOTE: Be sure to pick the end of the flow line at the inside curb polyline and not the top of curb. Otherwise, the routine to find the drainage area from the surface model will not capture flow along the curb:
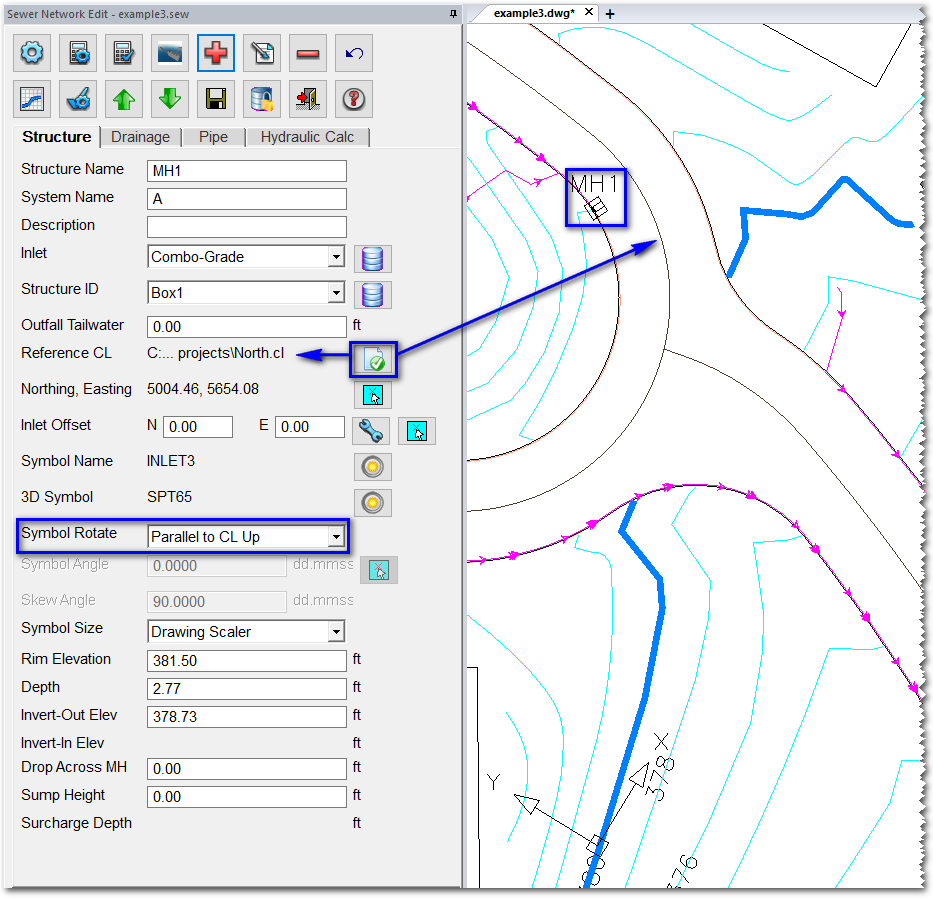
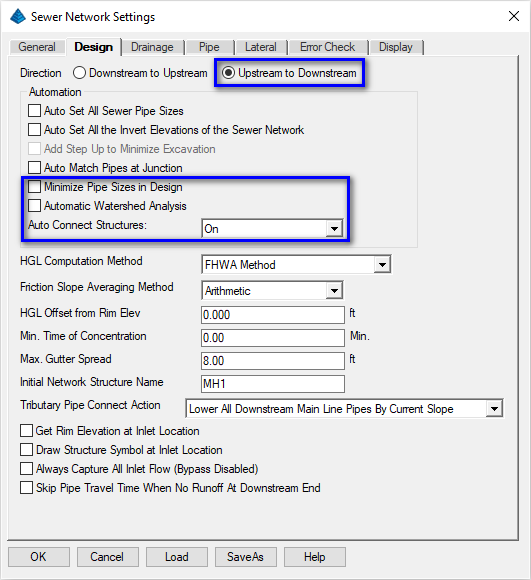
After this first inlet location is picked, the Sewer Network "docked" dialog is placed on the left side of the drawing as illustrated above. Click the Select (Paper) button next to the Reference CL label, select By Centerline File and select North.cl for the centerline. This centerline can/will be used to align the inlet symbol. In the Symbol Rotate field, select Parallel To CL Up. Let's establish some desired settings. Click the Settings (Gear) button and on the various tabs shown below, set the highlighted values:
| Design Tab | Drainage Tab |
|---|---|
|
|
| Pipe Tab | Display Tab |
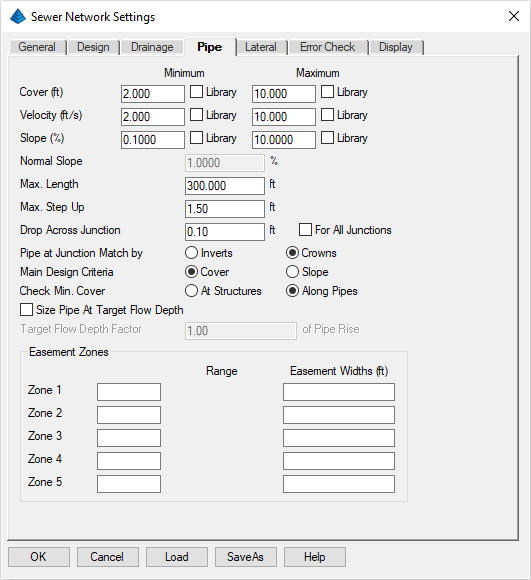
|
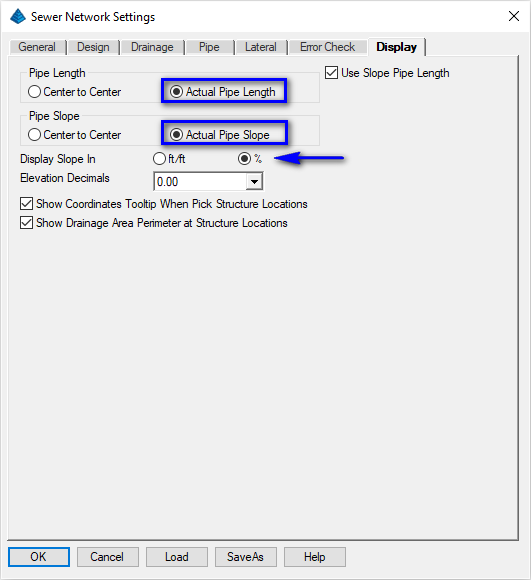
|
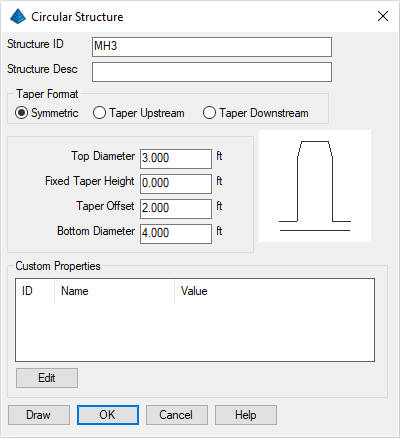
These dimensions are used for hydraulic calculations as well as drawing the structure in the profile and 3D views. Click OK from the Edit dialog, select/highlight MH3 from the library list and pick OK.
Next, pick the Library button next to the Inlet field. This function shows the inlets as otherwise defined through the Network -- Sewer Network Libraries -- Inlet Library. Like the Structure Library, you can add to and edit the Inlet Library. For this inlet, choose the Curb-Sag from the list and click OK.
The last change for the Structure tab is to set the Depth to 5.50. After making these changes, your dialog should match the settings as shown below:
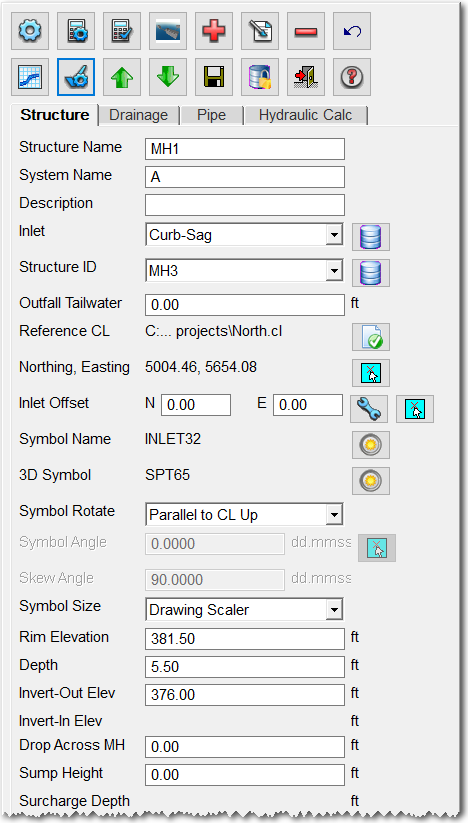
Pick the Apply Pipe Rules (Checkmark with Gear) button to save the changes and you should see the plan view symbol for the inlet change to a grate symbol.
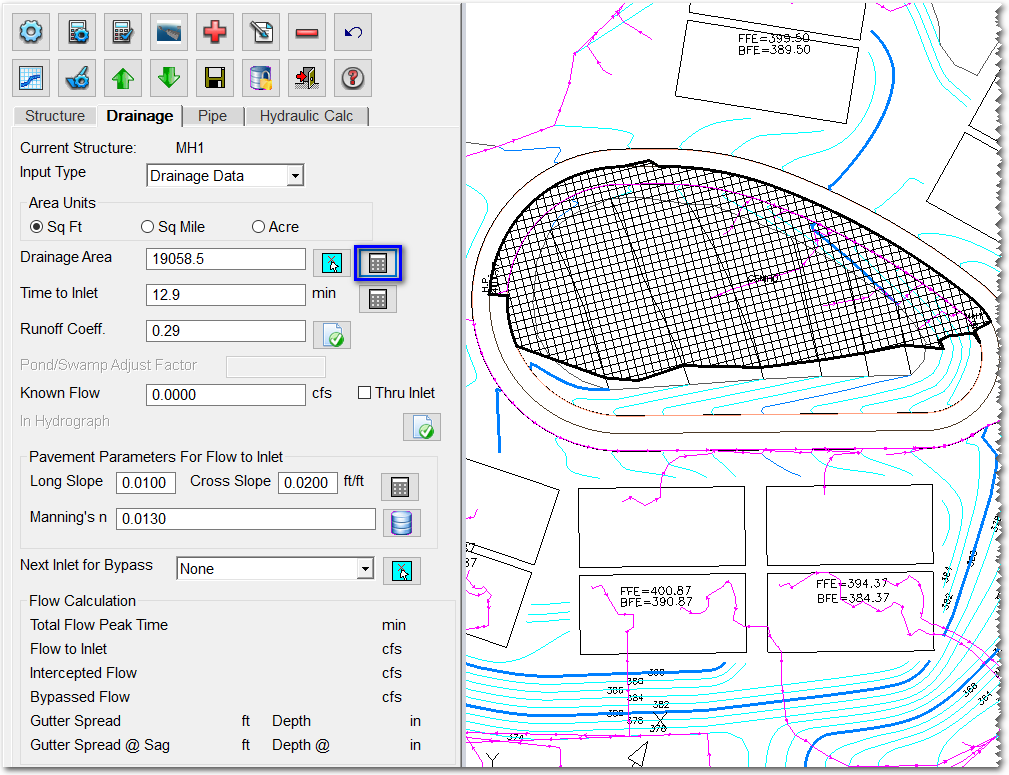
- The Time To Inlet comes from the Max Flow Line within the drainage area and accounts for the surface slopes along the path.
- The Runoff Coefficient is calculated as the weighted average of the runoff sub-areas within the drainage using the runoff layers that we defined in the Define Runoff Layers command.
- In the Pavement Parameters section, the Calc button will calculate the Pavement slopes from the surface aligned by the Reference CL at the inlet location.
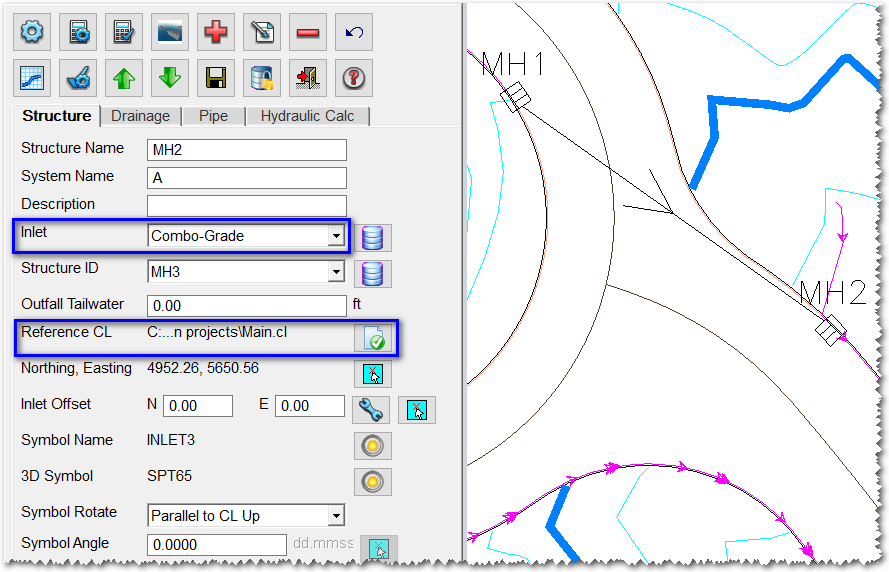
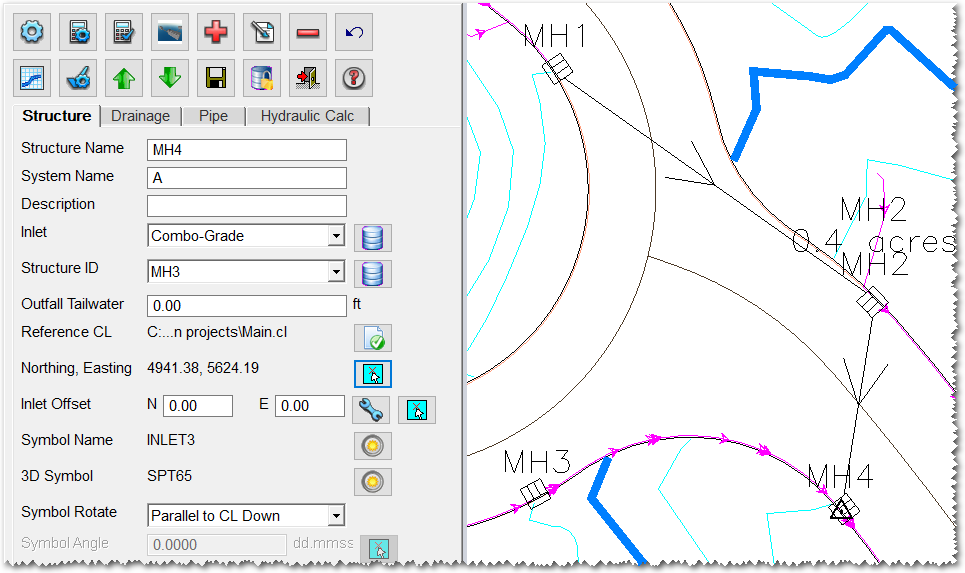
Go to the Structure tab for MH2 and change the Inlet type to Combo-Grade and the Reference CL to Main.cl. Then go to the Drainage tab and click the Calc to fill out all the drainage values.
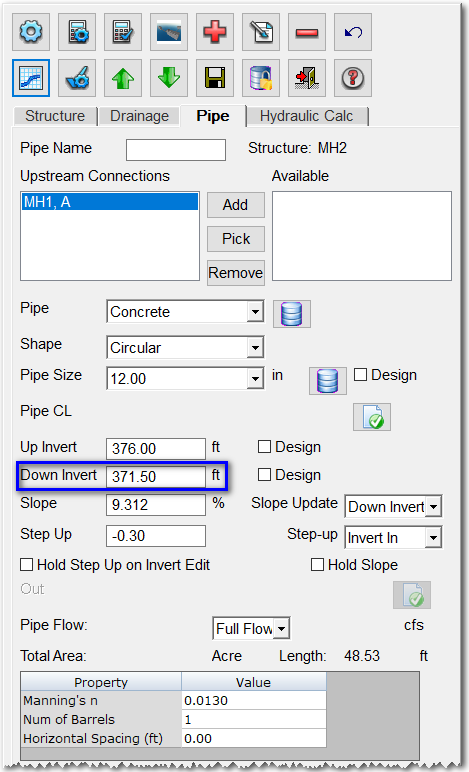
Next, select the Pipe tab. The program lists all the used and available structures for a pipe connection to the current structure. By default, a connection is made to the nearest structure as long as it's within the Maximum Pipe Length as defined under Settings. Set the Down Invert to 371.5 (as illustrated below) and switch back to the Structure tab and set the Invert-Out as 371.5:
To add the next inlet, click the Add button again. Then pick a position along the inside North loop curb polyline to the left of the intersection as shown here (MH3):
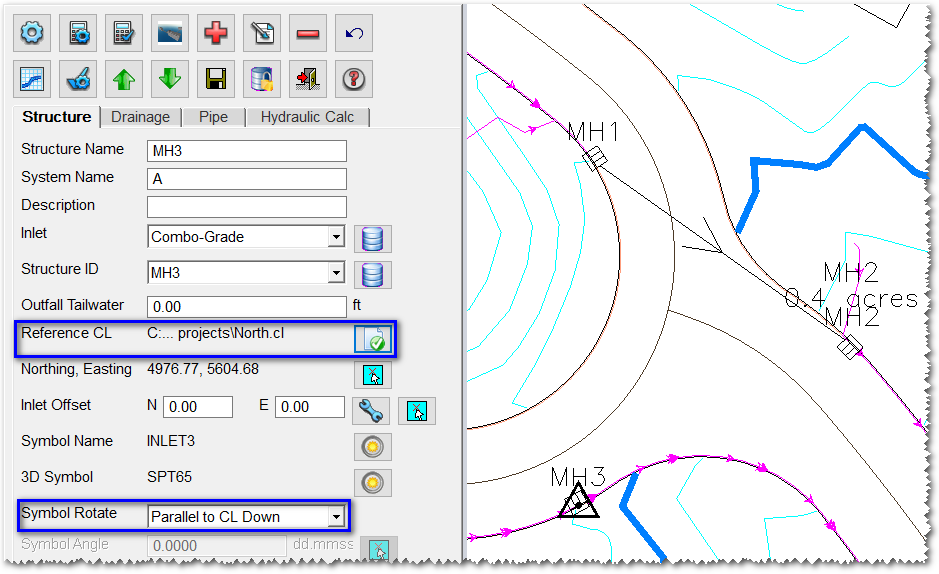
A pipe is automatically connected to the nearest structure (MH1). But for this network, we don't want MH3 to connect to MH1. Instead, we're going to start a new branch with MH3. So go to the Pipe tab, highlight the Upstream Connection of MH1 and click the Remove button. On the Structure tab for MH3, set the Depth to 7.0 and on the Drainage tab, click Calc.
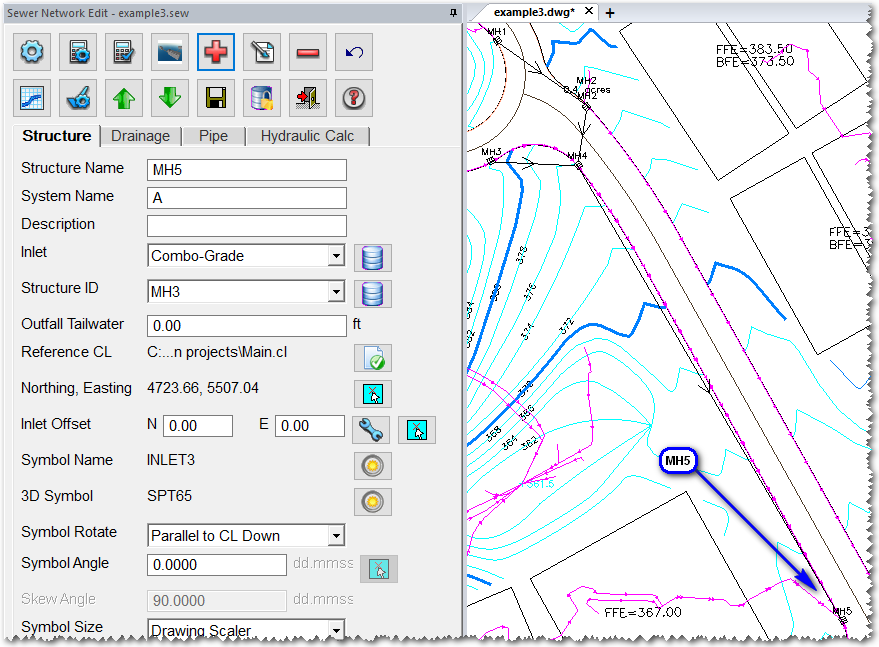
This inlet is on the other side of the road and the symbol is rotated the wrong way. To fix this, go to the Structure tab and change the Symbol Rotate to Parallel To CL Down. Also, change the Invert-Out to 371.0 and pick Apply to update the drawing. Next go to the Drainage tab and pick the Calc button. Again the pipe connection defaulted to the nearest structure of MH2. We want the connections from MH3 and MH2 to go to MH4. Under the Pipe tab, highlight the Available connection for MH3 and click Add. For the pipe parameters, change the Down Invert to 371.1. Then go back to the Structure tab and set the Invert-Out to 371.0.
Under the Drainage tab, pick Calc. We have one more inlet to add. Click the Add button from the Structure Actions row and screen pick along the curb on the other side of the Main road from MH5. See MH6 in the graphic below:
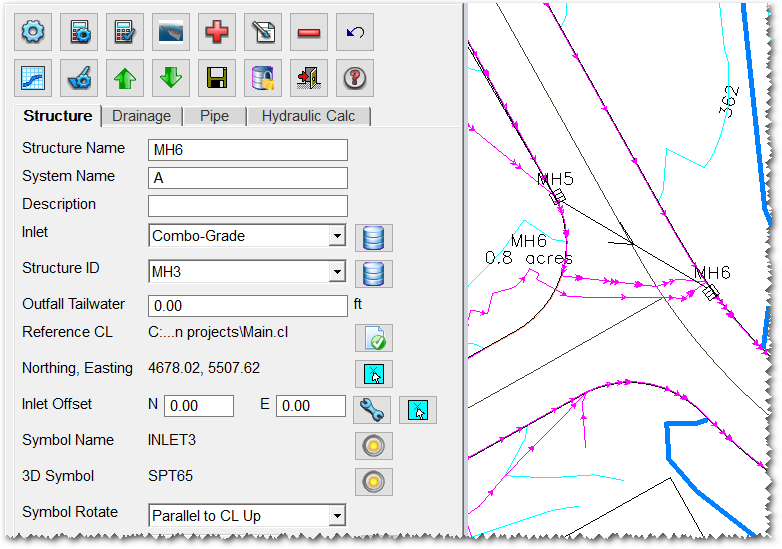
Under the Structure tab, set the Symbol Rotate to Parallel To CL Up to flip the symbol around. Under the Drainage tab, pick Calc. For the last structure, click the Add button from the Structure Actions row and pick on the 356 contour in the pond to the right of MH6:
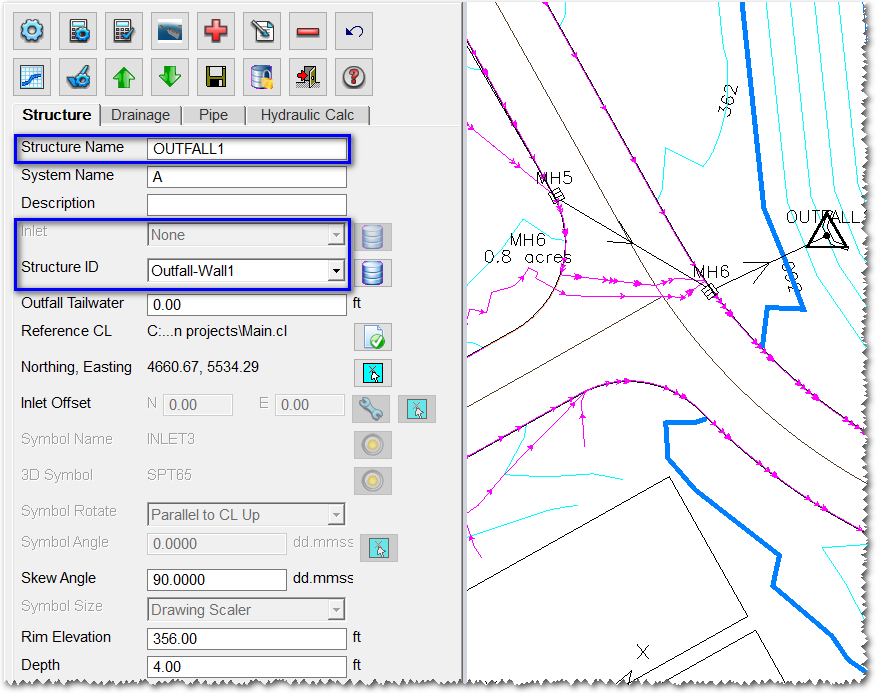
In the Structure tab, make the highlighted changes and click Apply.
NOTE: You may get a Pipe Rules alert indicating potential problems with the network. If this is the case, click the Update All button.
The initial sewer network layout is done. Click the Save (Floppy Disc) button.
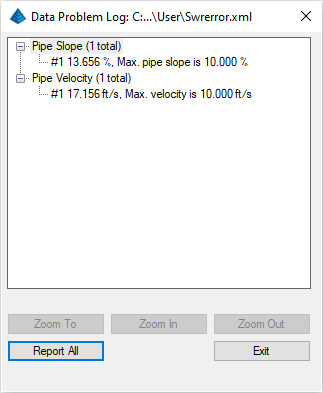
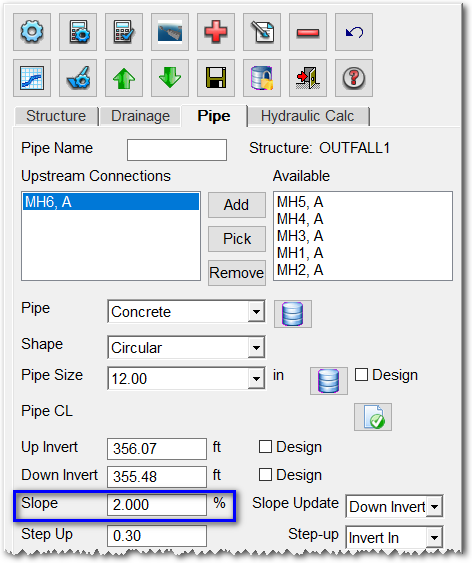
Let's take care of Warning #1 for the pipe slope. Use the Up/Down Arrows to navigate or click the Edit (Paper with Pencil) button on the Structure Actions row and pick the Outfall label or symbol to edit the Outfall structure. Set a target slope for the MH6 to Outfall as suggested below:
Click the Analyze button again. The warning report should only have the flow velocity warning(s), if any. Exit the report if it comes up. The flow velocity warnings can be resolved by resizing pipes and setting inverts which we will do later. Now let's review the flow results from the dialog. From the Outfall structure, click the Up button to move up to MH6. From the Drainage tab, the flow results are displayed in the Flow Calculation section. The Flow To Inlet is calculated by the Rational Method using the Drainage Area, Time Of Concentration and Runoff Coefficient for this inlet. The Intercepted Flow, Bypassed Flow, Gutter Spread and Gutter Depth are calculated from the inlet dimensions using formulas from HEC-22. These values can be used to determine whether you have the right inlet structure to capture the flow.
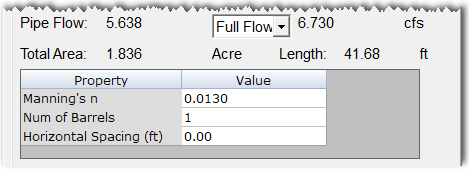
Switch to the Pipe tab. The Flow, Area and Length are displayed for the pipe connection currently highlighted from the Upstream Connections list. The Total Flow is the accumulated flow for the current pipe and the Total Area reports the accumulated drainage areas for all the inlets coming into this pipe:
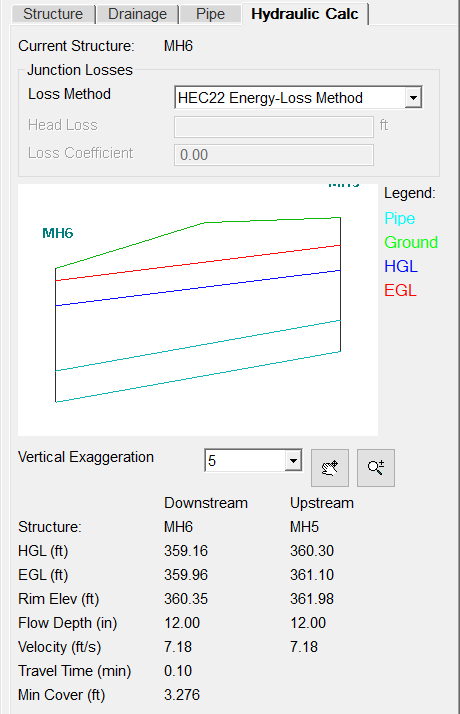
Switch to the Hydraulic Calc tab which shows a graphic of the pipe structure, ground surface, hydraulic grade line (HGL) and energy grade line (EGL), along with the HGL and EGL elevations, Flow Depth and Flow Velocity at the pipe upstream and downstream connections. The Min Cover (calculated using the surface model to the top of the pipe) is also displayed:
You can go to other structures to check the flow values for them or use the Network -- Report Sewer Network command to review the values in a report view. For our storm event, many of the pipes can be resized. To resize the pipes, you can go to the Pipe tab and change the Pipe Size. The program can also automatically size the pipes based on the flow:
- To size specific pipes, go to the Pipe tab and pick on the Design toggle next to the Pipe Size field. Then click the Design (Calculator with Gear) button in the Structure Actions row and the program will run a flow analysis and set the pipe size for these pipes marked for Design.
- To have the program size all the pipes, click the Settings button and select the Design tab and enable the Auto Set All Pipe Sizes option (click OK) and then click the Design button.
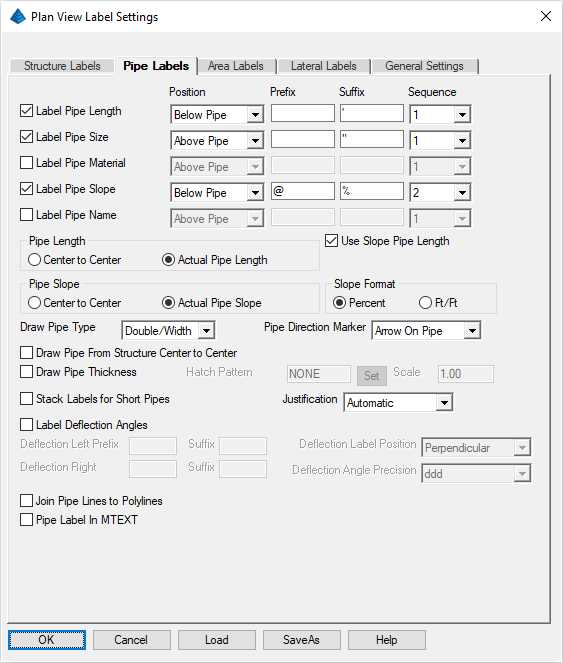
Set the values as illustrated above and click the OK button. The labels should update in the drawing.
NOTE: The sewer labels are linked to the sewer network definition so that any change to the sewer network updates the labels. If you want to explicitly update the sewer labels, issue the Network -- Draw Sewer Network -- Plan View command.
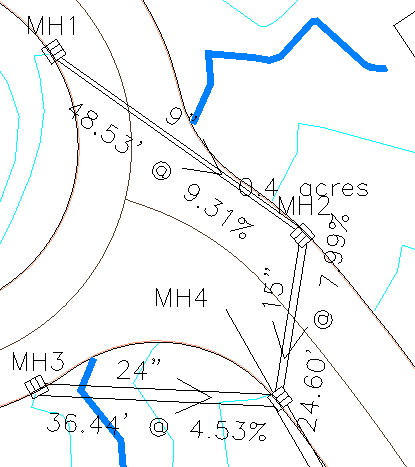
When sewer labels overlap other drawing entities, you can use the Network -- Sewer Labels -- Move Plan View Label command. Let's run this command and move the MH4 label to the left of the inlet as illustrated in the example below:
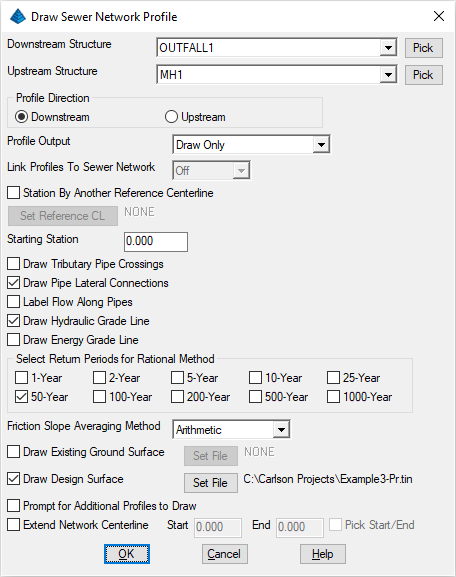
Set the values as shown above and click OK when ready. A dialog box similar to that shown below appears:
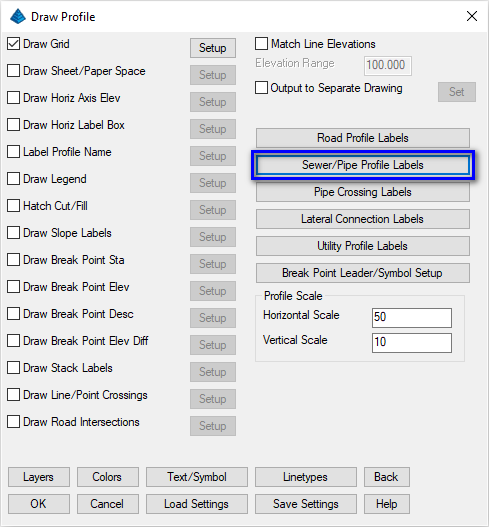
NOTE: Explore the Sewer/Pipe Profile Labels button to further detail the content to be shown.
Set the values as shown above and click OK when ready. A dialog box similar to that shown below appears:
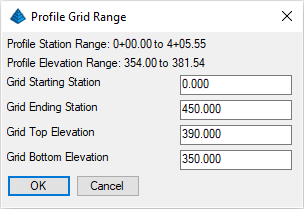
The elevations default to fit the profile, so click OK. When prompted:
Pick Starting Point for Grid <0.00,0.00>: pick the lower left profile grid point
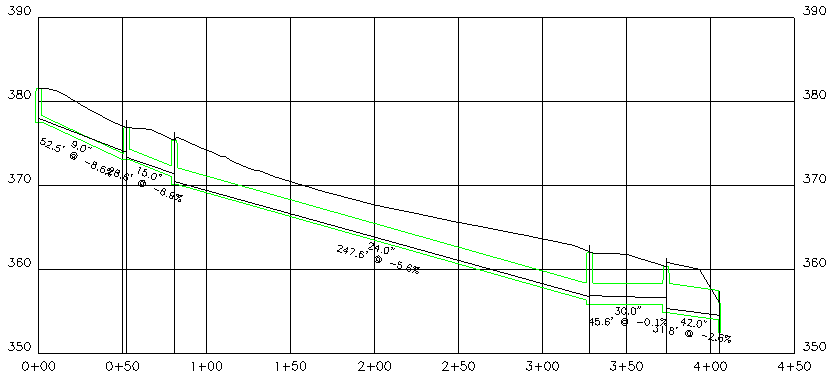
Your profile may appear similar to that shown below:
Draw Sewer Network 3D Faces (Dialog): click OK
To view the 3D Faces, issue the View -- 3D Viewer Window command and when prompted:
Select entities for the scene.
[FILter]/<Select entities>: type ALL and press Enter
[FILter]/<Select entities>: press Enter
Click and drag the mouse to rotate the view to a good viewing angle as shown below:
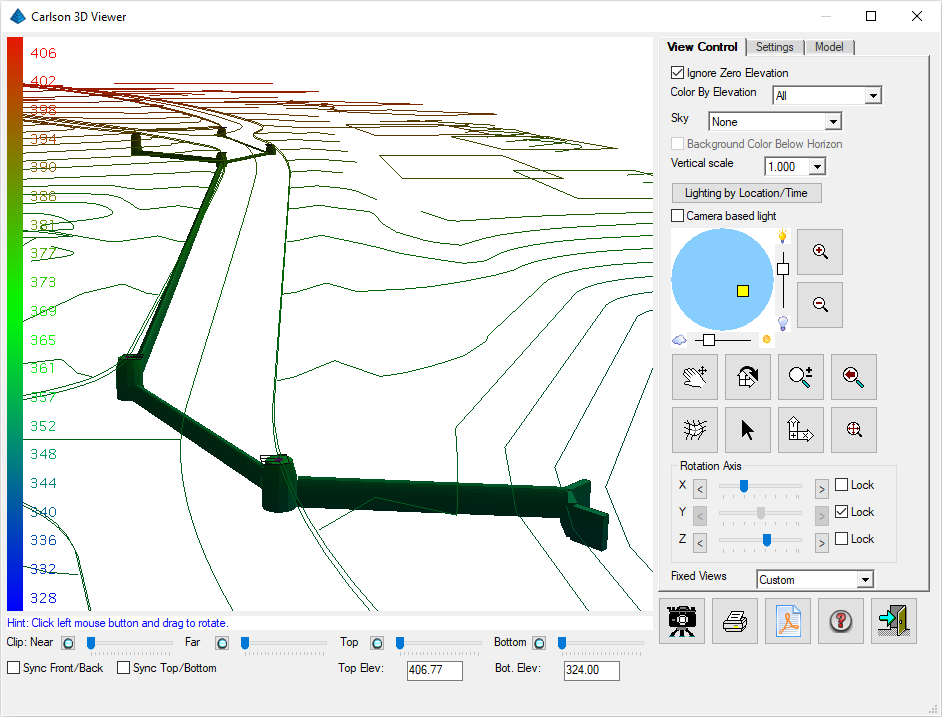
When done inspecting, dismiss the viewer by picking the Exit (Doorway) button.
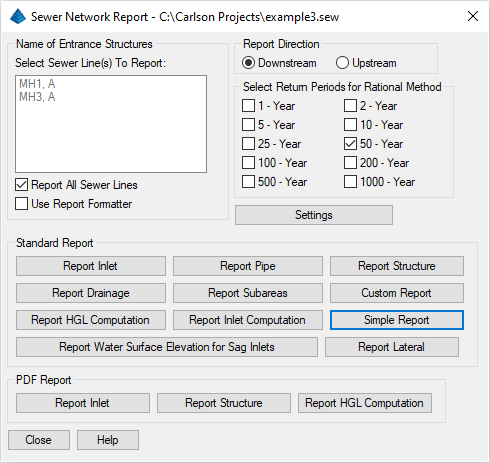
Let's run the Simple Report to get the summary of the system that displays in the Standard Report Viewer similar to that shown below:
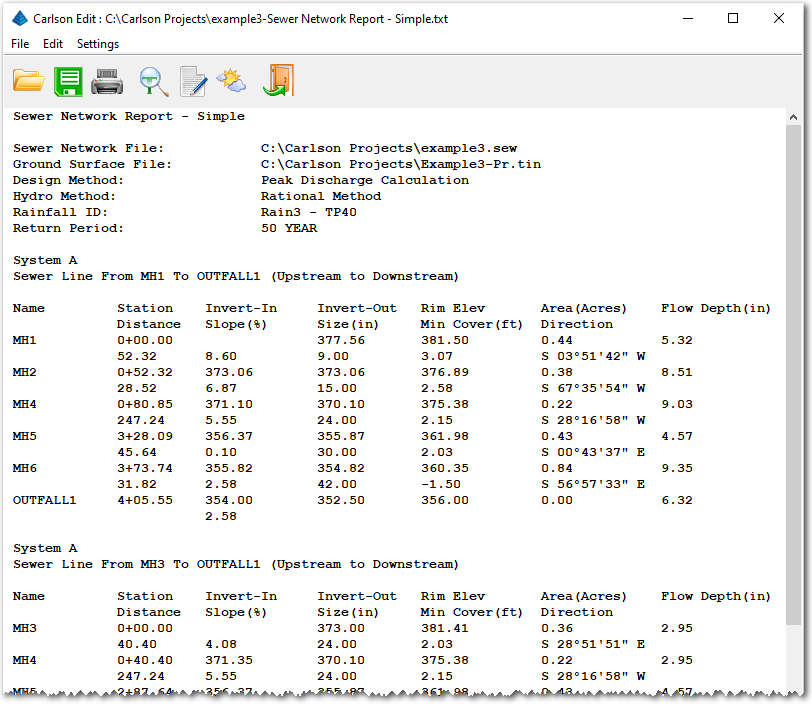
Review the report and then click the Exit (Doorway) button and then click the Close button to dismiss the Sewer Network Report dialog box.