Geodetic Reports
In this lesson you will create a geodetic report containing both
local and Grid coordinates from a survey based on an assumed local
datum. The plan geometry will be annotated with both ground and
grid distances. This is useful when a survey has been performed
with assumed coordinates and elevations but must be reported in
Grid coordinates or in instances where both ground and grid
coordinates need to be reported.
- Click the Windows desktop icon for Carlson to start
the program.
- If you get the Start Page, pick
Open Files.
- If you get the Startup Wizard
dialog box, click the Browse button.
- If you are taken directly into CAD, click File --
Open.
Browse/navigate to the default folder location of
C:\Carlson Projects and open the
Local-Plat.DWG file.
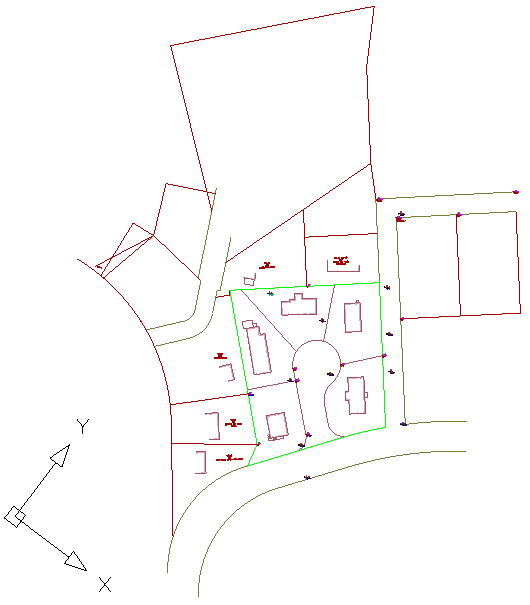
- Activate the Survey menu via Settings -- Carlson Menus --
Survey Menu. Your drawing should resemble that
shown below:
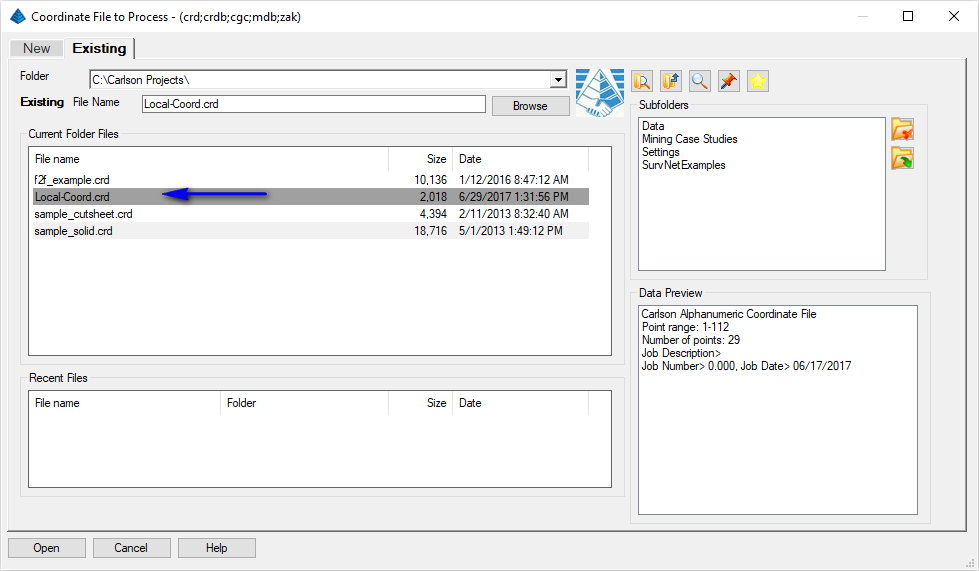
- Issue the Points -- Set
Coordinate File command and select the supplied file
Local-Coord.CRD as shown below:
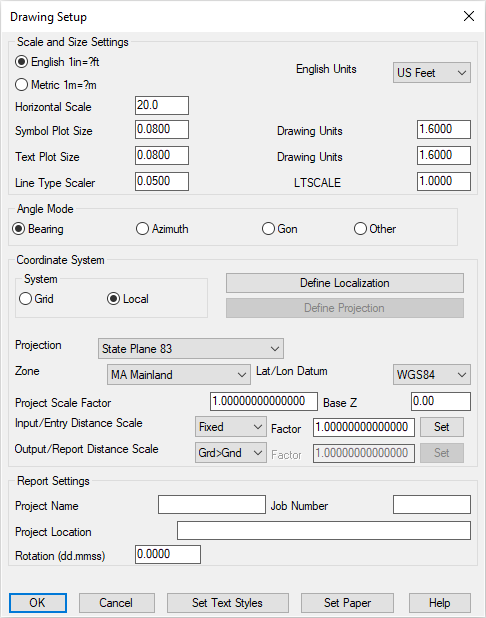
- Issue the Settings -- Drawing
Setup command to display a dialog box similar to that shown
below:
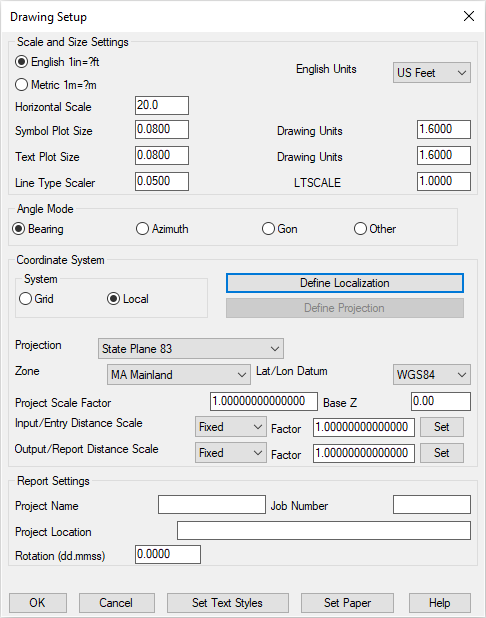
Set the:
- Projection to State Plane 83,
and
- Zone to MA Mainland.
- Click the Define Localization button to
display a dialog box similar to that shown below:
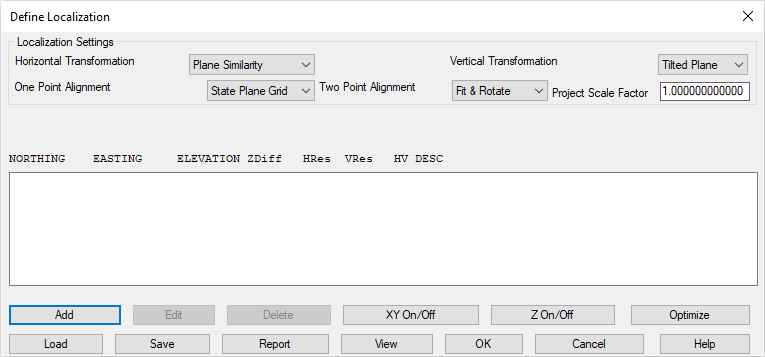
- We'd like to localize the drawing based on two RTK GPS points
that were located to establish grid coordinates. We'll be using
points 52 and 56. Click the
Add button to display a dialog box similar to
those shown below:
Localized Points
| Point 52 |
Point 56 |
|
|
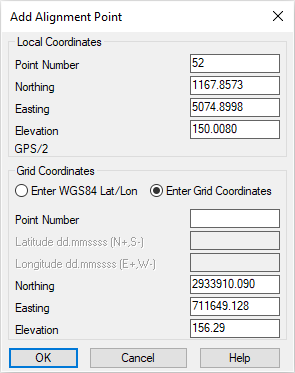
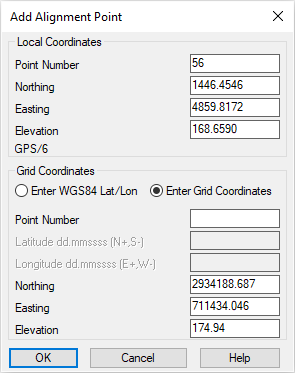
Add the point and coordinate information for each point by entering
the Local Point Number (press the Tab key
to complete the Local data) and their respective Grid
Coordinates as outlined in the table below (click
OK when ready and subsequently click
OK to accept the default point descriptions):
Localized Point Data
| Point Number |
Local Northing |
Local Easting |
Local Elevation |
Grid Northing |
Grid Easting |
Grid Elevation |
| 52 |
1167.8573 |
5074.8998 |
150.0080 |
2933910.090 |
711649.128 |
156.29 |
| 56 |
1446.4546 |
4859.8172 |
168.6590 |
2934188.687 |
711434.046 |
174.94 |
- The results should resemble that shown below:
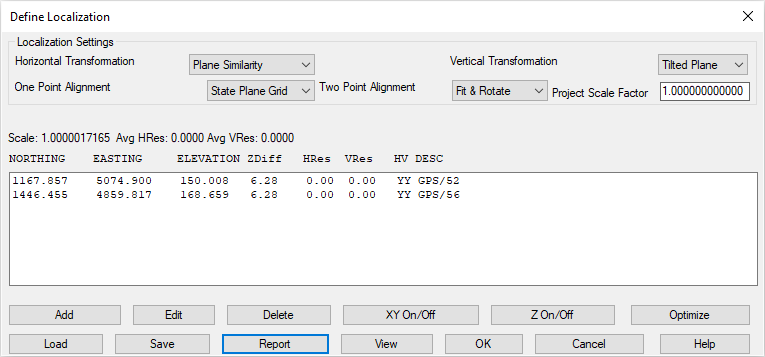
NOTE: For each point, make sure the
HV (Horizontal/Vertical) fields are set to
YY (indicating Yes, both the Horizontal
and Vertical components should be used in the solution). Use the
XY On/Off button and/or the Z
On/Off button as necessary.
- Click the Report button to display the dialog
box below:
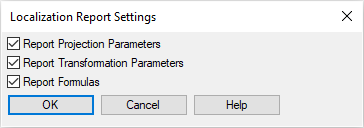
Ensure all of the report options are enabled and click
OK. The localization report similar to that shown
below is displayed in the
Standard Report Viewer:
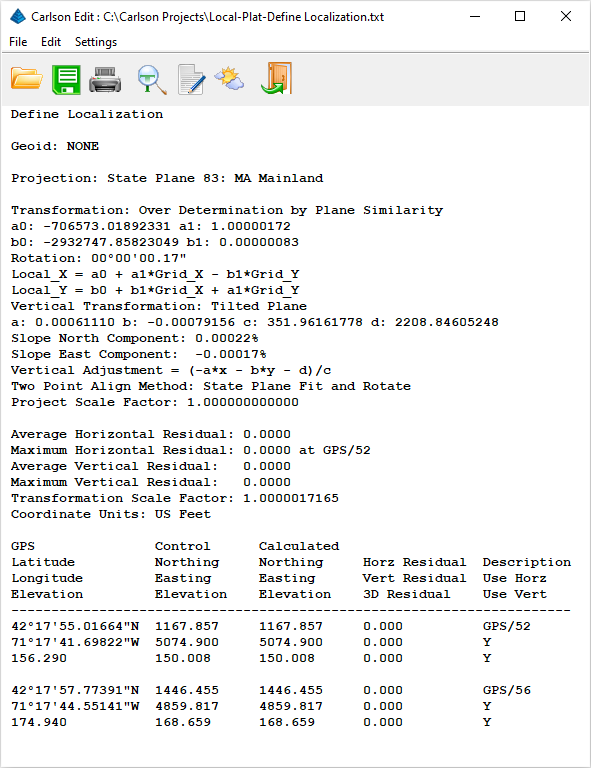
Click the Exit (Doorway) button to dismiss the
report. Further, click the OK button on the
Define Localization and Drawing Setup dialog
boxes, respectively.
- Issue the Points -- List Points
command to display the dialog box similar to that shown
below:
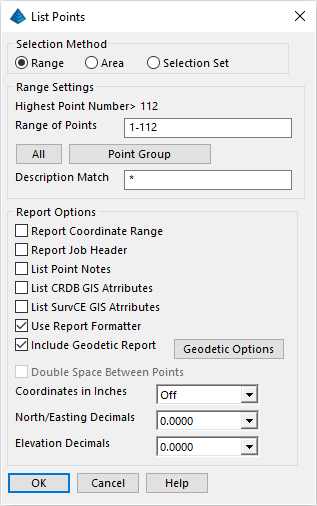
Enable the Use Report Formatter and
Include Geodetic Report options and click
OK when ready.
- The
Report Formatter dialog box appears similar to that shown
below:
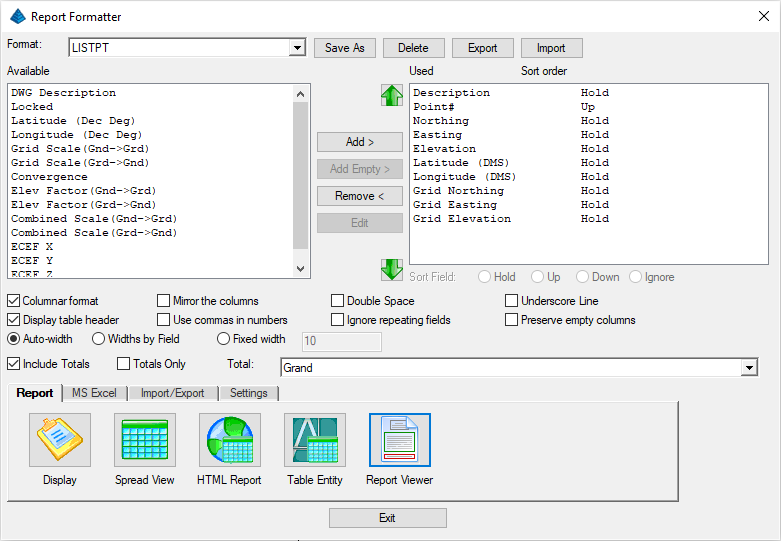
Select the desired Available fields on the left
and click Add > to move them to the
Used fields on the right. Set the fields to that
shown above.
- From the Report tab, click on the
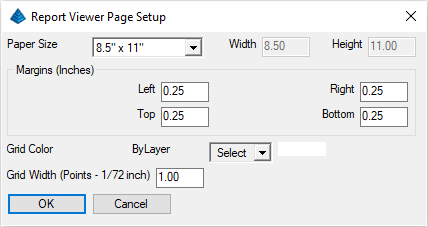
Report Viewer button. Select an 8.5" x
11" paper size with 0.25" margins all
around as shown below and click OK when ready:
The resulting report is displayed similar to that shown below which
can be printed or exported to various formats:
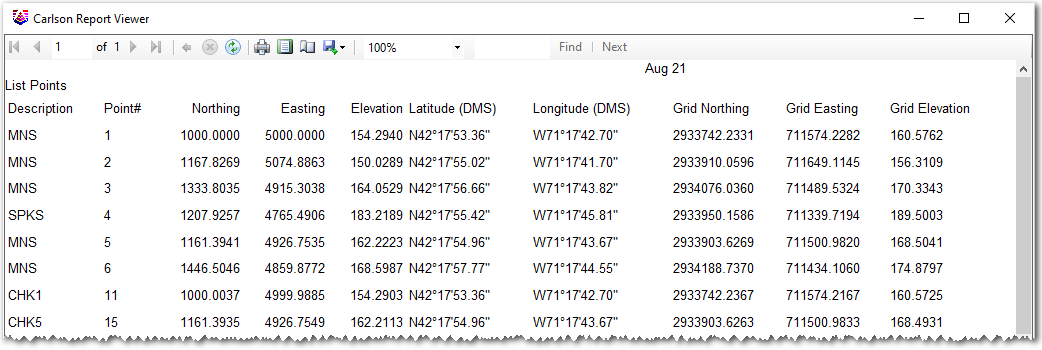
Both local and grid coordinates are displayed.
NOTE: To further control the report by adding
user-defined fields, customized Headers and Subheaders, Fonts
etc, refer to the Cut Sheet tutorial.
- Close the report to return to the Report
Formatter dialog box. Click the Exit
button to dismiss the Report Formatter dialog box.
- Re-run the Settings -- Drawing Setup as discussed earlier:
Set the Report Distance Scale option to
Gnd>Grd for ground to grid distances and click
OK when ready.
- Issue the Annotate --
Annotate Defaults command to display the dialog box similar to
that shown below:
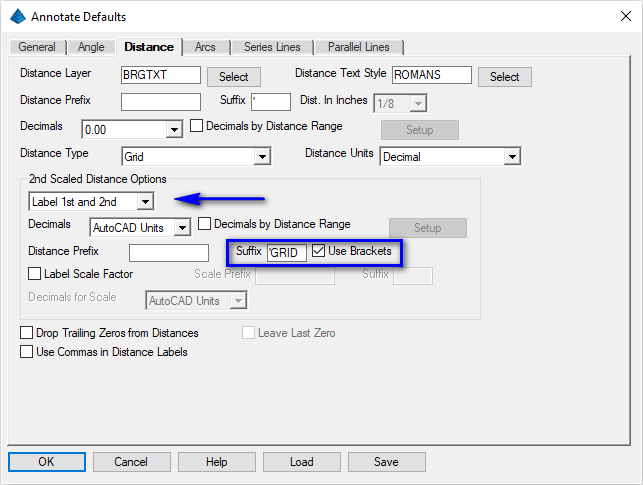
In the Distance tab, set the 2nd Scaled Distance
Options to Label 1st and 2nd. Also, set
the Suffix to 'GRID and enable
the Use Brackets option. Click OK
when ready.
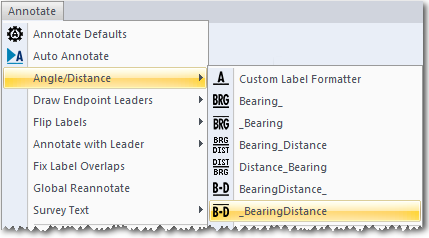
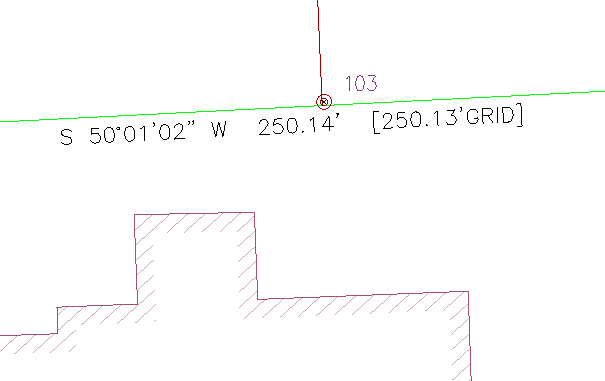
- Issue the Annotate -- Angle/Distance
-- _BearingDistance command:
When prompted:
Select line or polyline [Size/Points]:
select the most northerly property line of the
parcel
Select line or polyline [Size/Points] (Enter
to end): press Enter
Both the ground distance and the projected scaled distance are
labeled as shown below (layer visibility altered for clarity):
This completes the tutorial: Geodetic Reports.