- If you get the Start Page, pick Open Files.
- If you get the Startup Wizard dialog box, click the Browse button.
- If you are taken directly into CAD, click File -- Open.
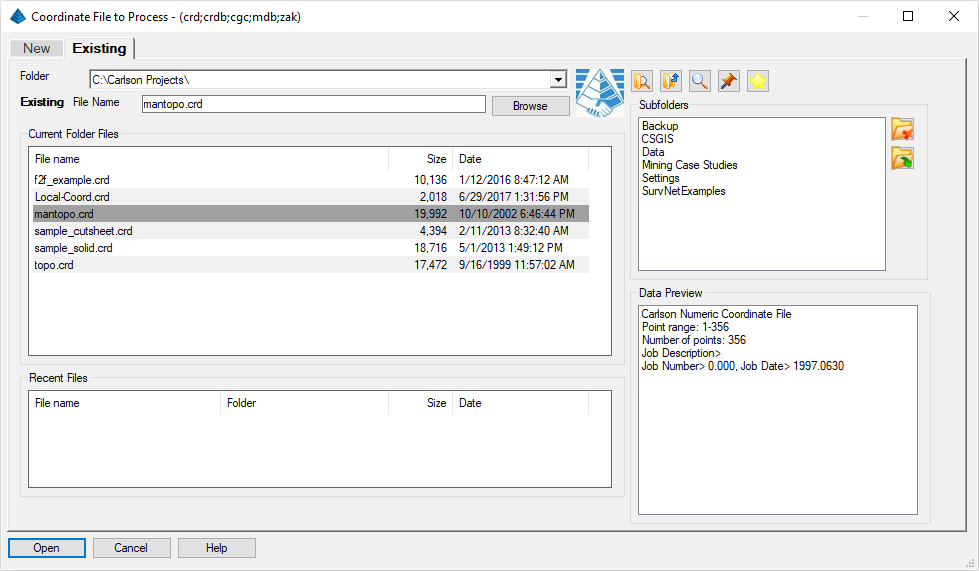
Issue the Points -- Set Coordinate File command to display the following dialog box:
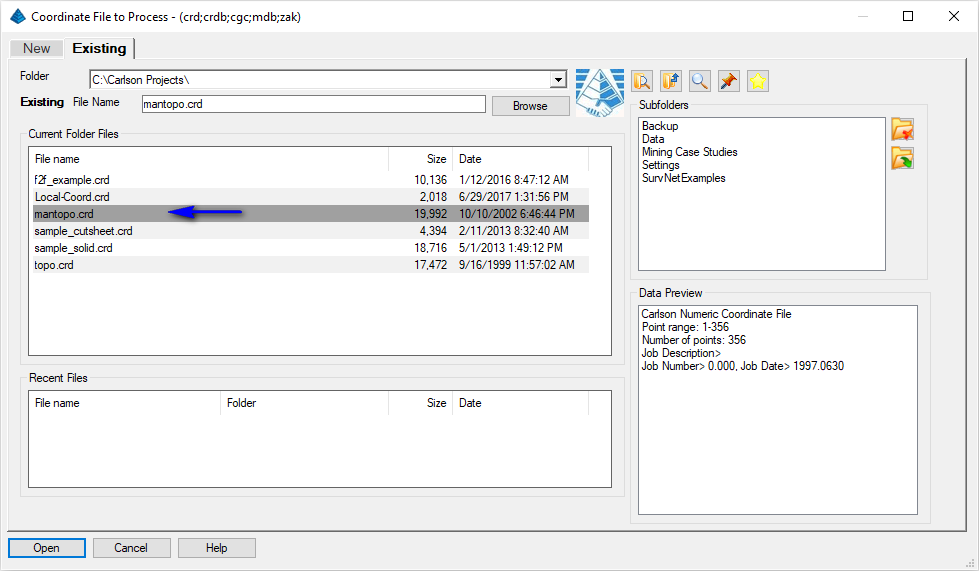
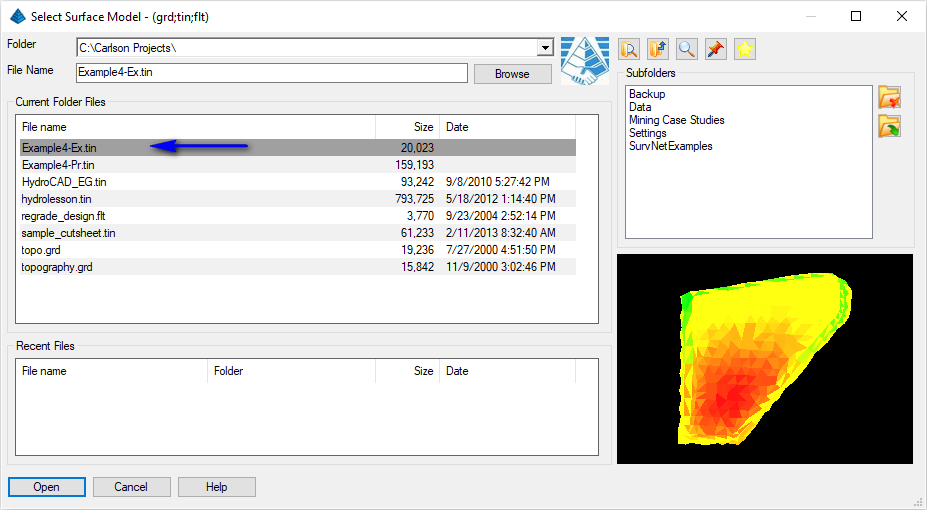
Select the file as shown above and click Open when ready.
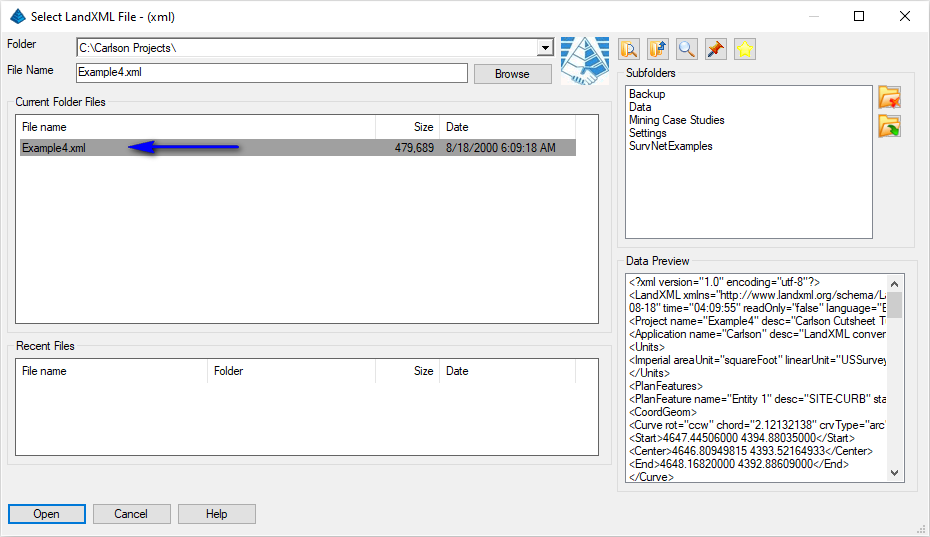
Select the file as shown above and click Open when ready. A secondary box similar to that shown below will appear:
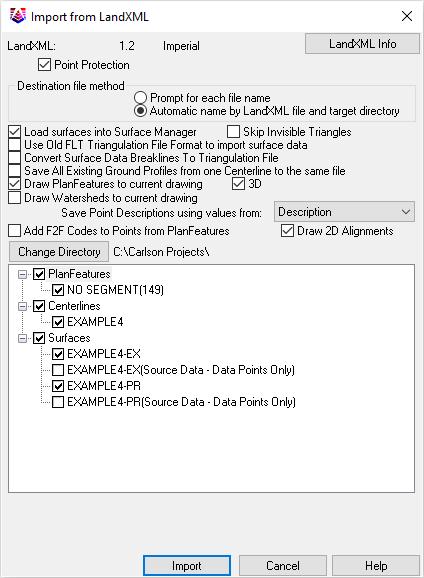
Set the various options as shown above and click Import when ready. A summary of the surface model TIN files will appear in the Surface Manager similar to that shown below:
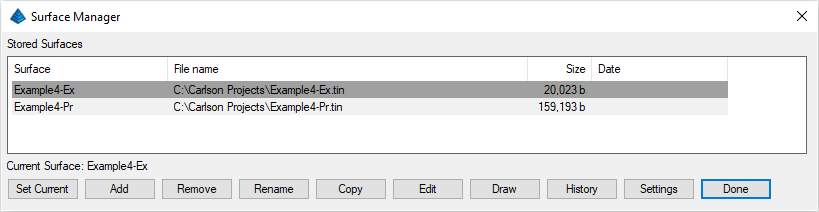
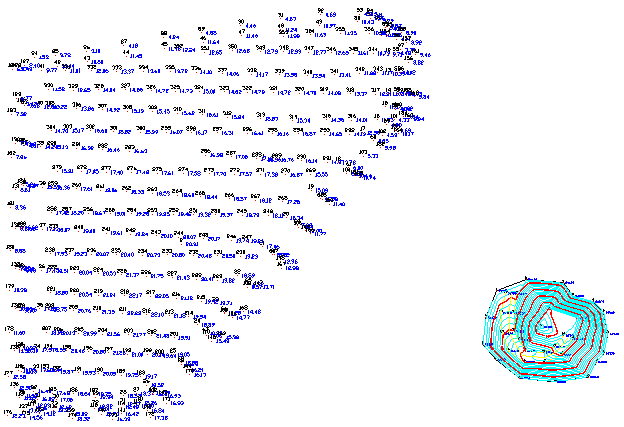
Click the Done button when ready. The drawing should resemble that shown below (layer colors and visibility altered for clarity):
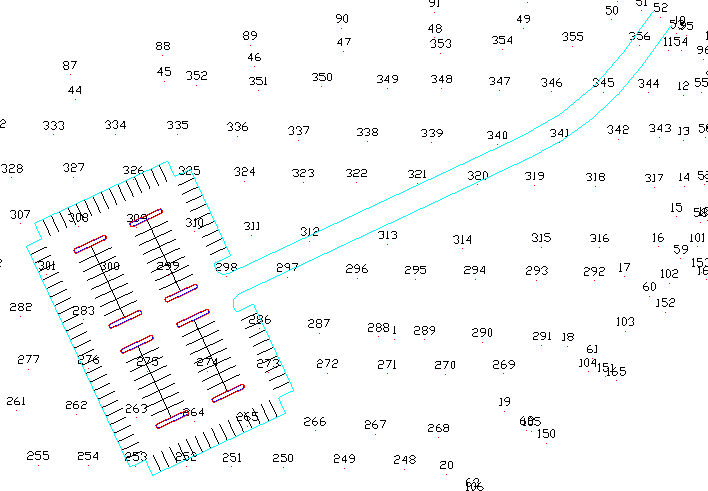
The drawing contains a proposed parking lot with striping and curb islands. A closer examination will reveal that the entire length of the roadway and parking lot perimeter has been defined as a centerline (aka alignment, Existing4.cl) file as created by the Polyline to Centerline File command (e.g. double-clicking the perimeter should display the Centerline Editor command).
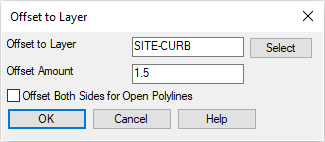
Set the values as shown above and click OK when ready. When prompted:
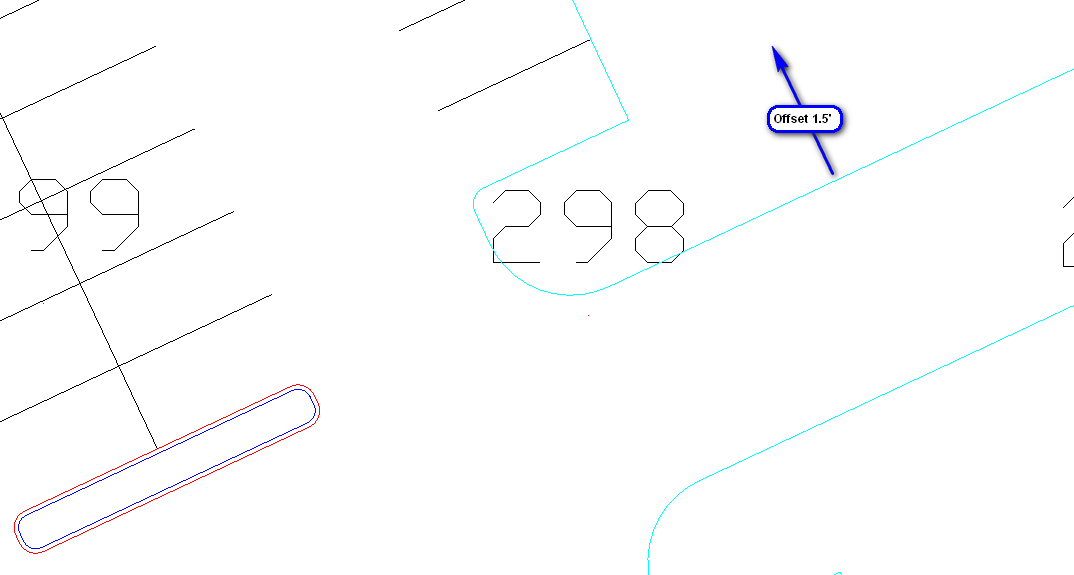
Select a polyline to offset: pick the perimeter polyline as shown below
Select side to offset: pick to the outside as shown below
Select a polyline to offset (Enter to end): press Enter
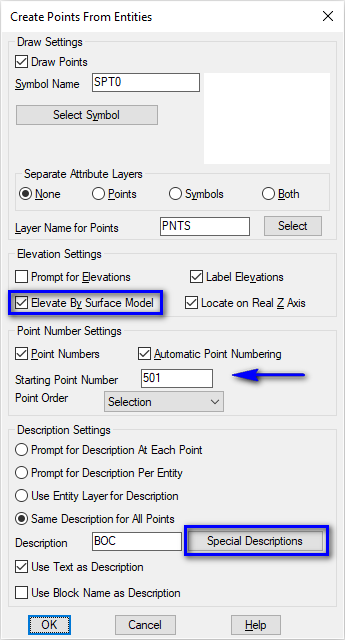
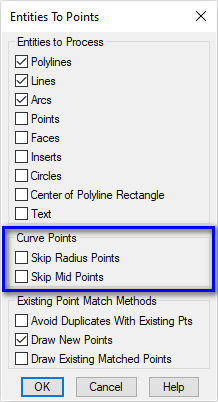
Set the values as shown above (making particular note of the highlighted items above) and click OK when ready. A secondary dialog box as shown below appears:
Set the values as shown above (making particular note of the highlighted items above) and click OK when ready. A dialog box prompting for the surface model use for the point elevation appears (similar to that shown below):
Select the surface model as indicated above and click Open when ready. When prompted:
Select arcs, circles, faces, points, text, lines and polylines.
[FILter]/<Select entities>: pick the back-of-curb polyline created in the previous step
[FILter]/<Select entities>: press Enter
A collection of points is inserted into the drawing and at an elevation governed by the previously cited surface model.
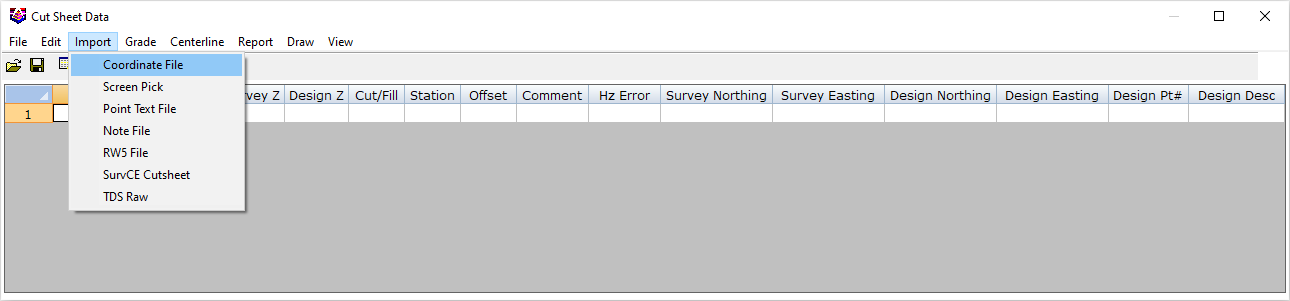
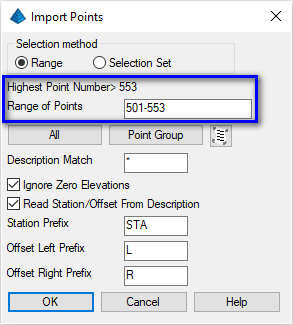
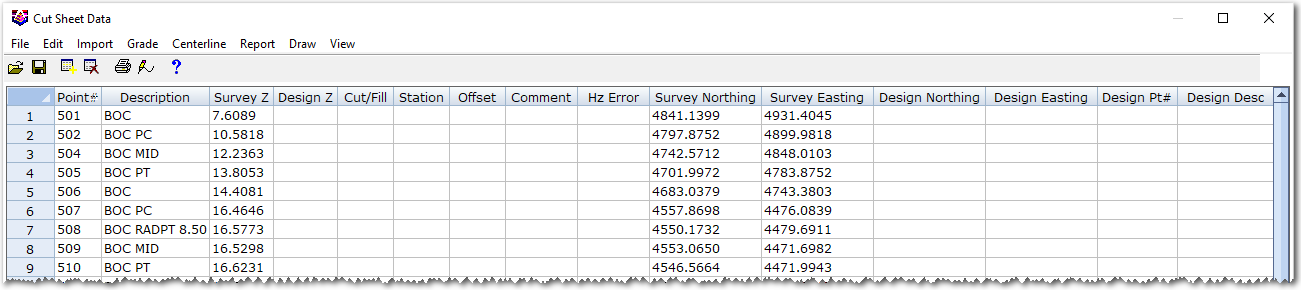
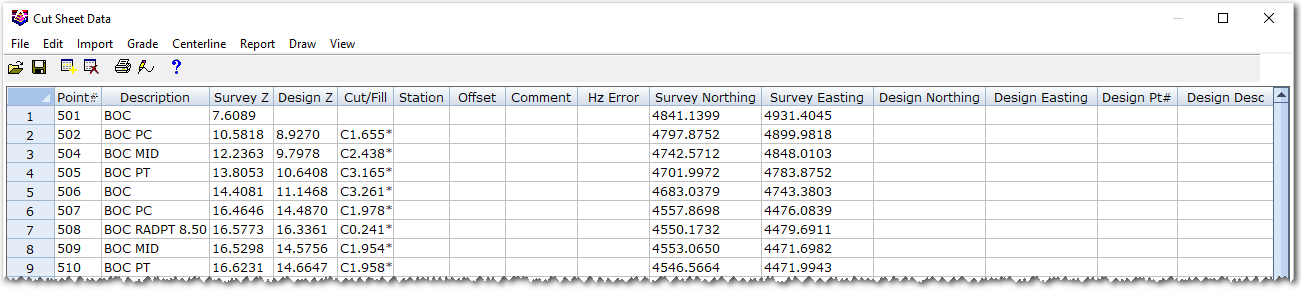
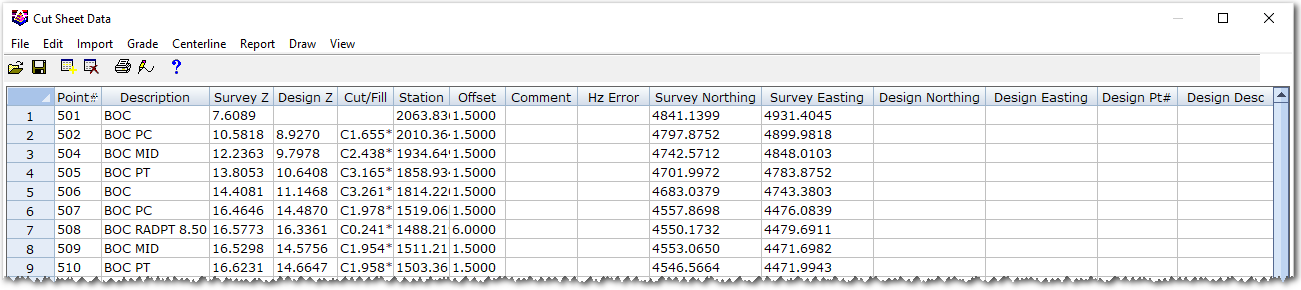
The coordinate file may have more data than we need (i.e. original ground points from an earlier lesson). Set the values as shown above, paying particular attention to the Range of points in the range of 501-553. Click OK when ready. The Cut Sheet Data dialog box is populated with data similar to that shown below:
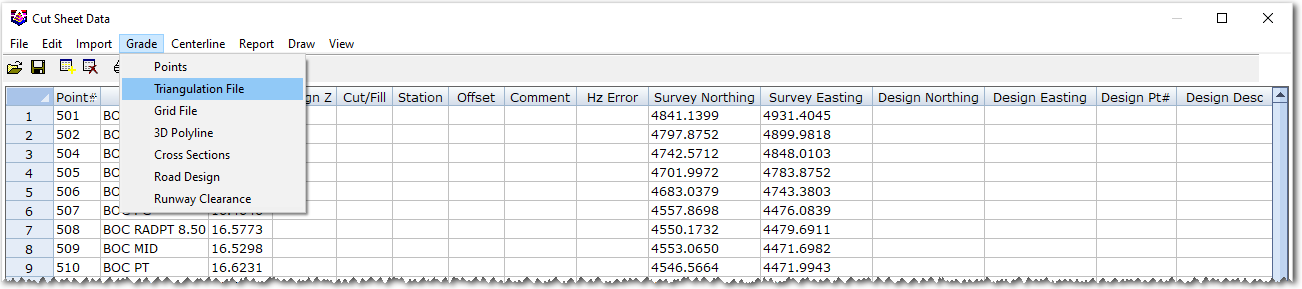
When prompted, select the triangulation (TIN) file cited below and click Open when ready:
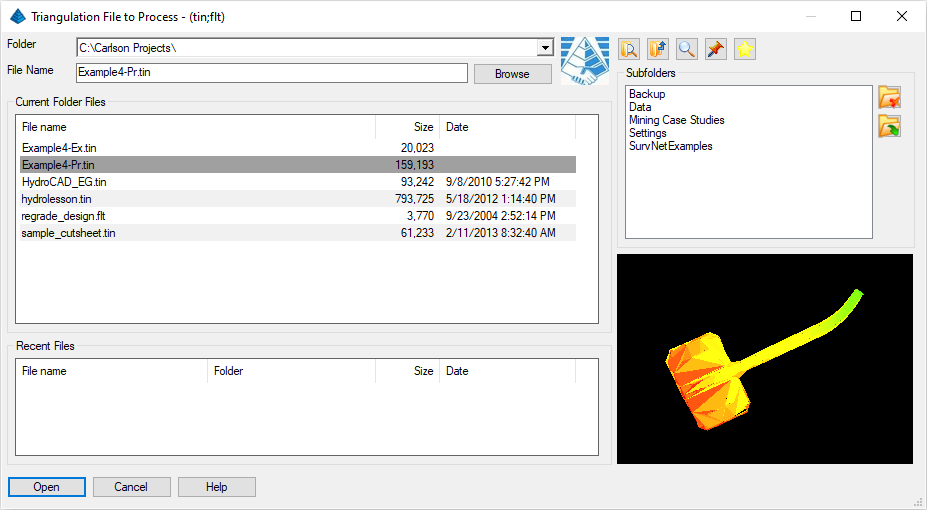
This process will select a design surface model for the proposed grades. The Design Z elevation field is populated from the proposed TIN and the Cut/Fill amount per point is calculated as illustrated below:
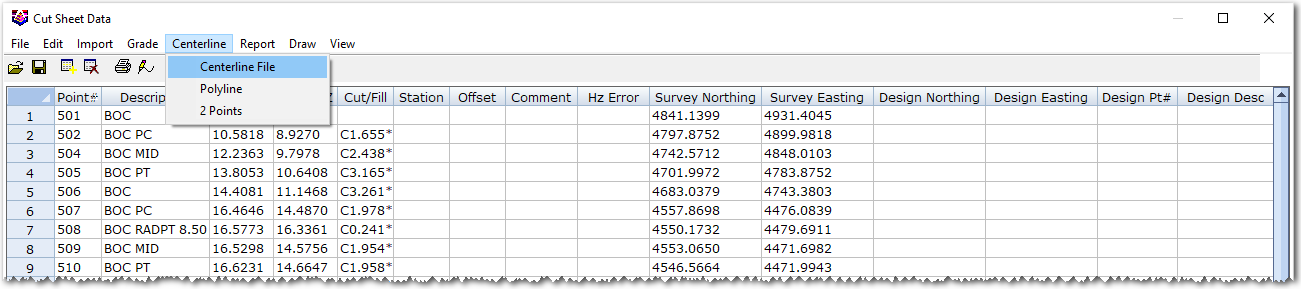
When prompted, select the centerline (*.cl) file shown below and click Open when ready:
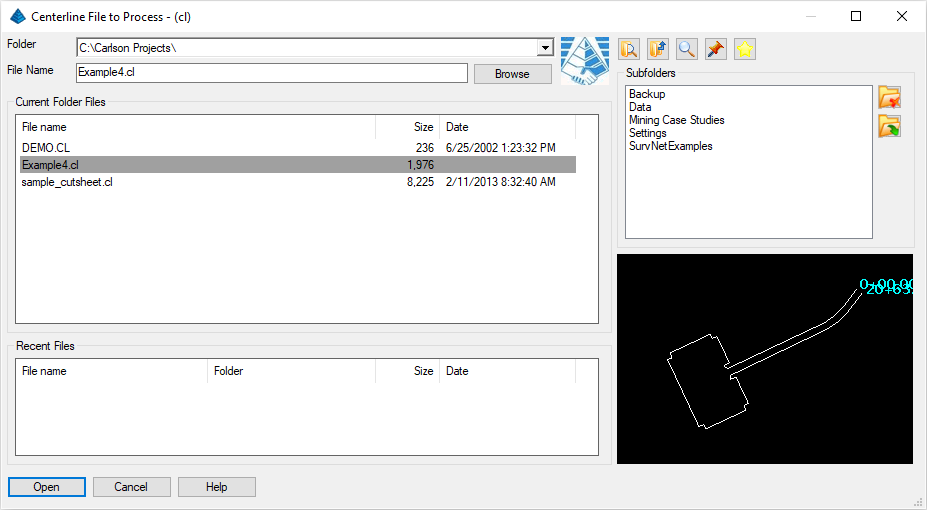
The Cut Sheet now contains the station and offset information for the curb line as illustrated below:
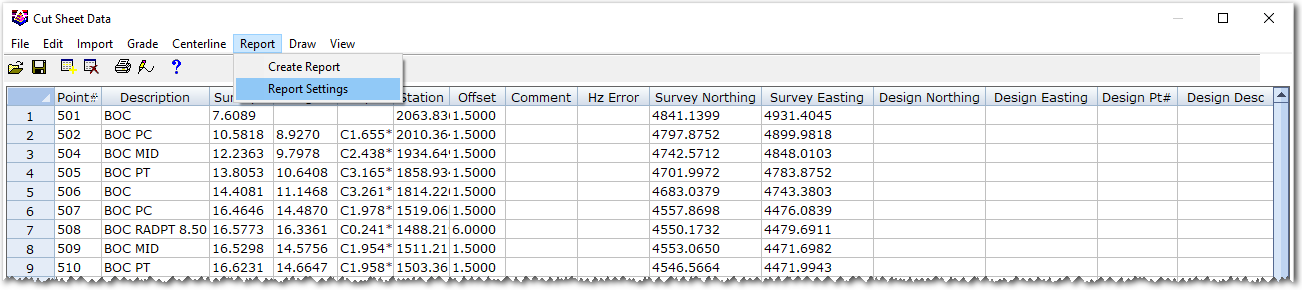
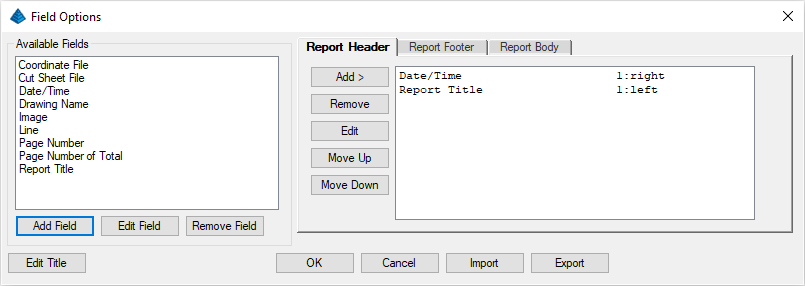
The Report Options dialog box appears permitting the eventual report to be customized:
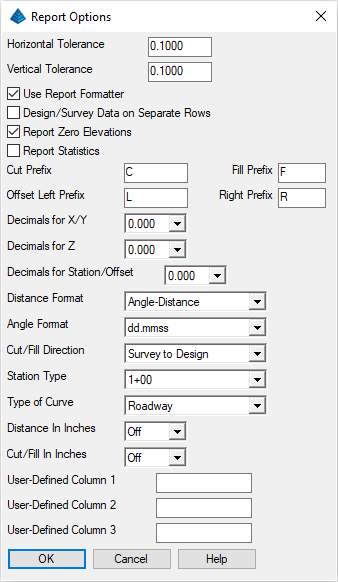
Ensure the Report Options are set as shown above and click OK when ready.
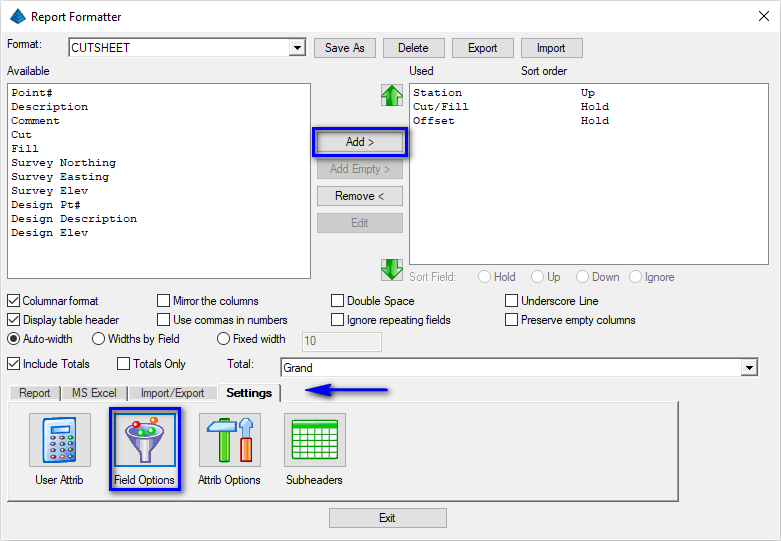
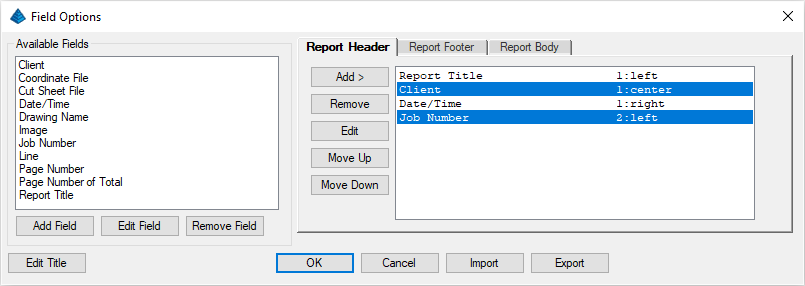
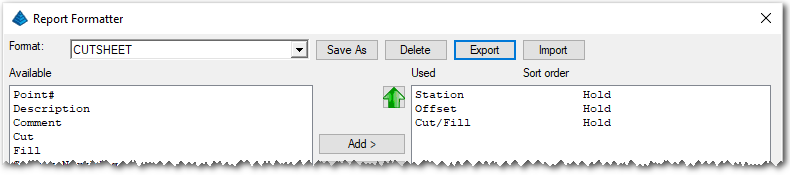
Select the desired Available fields on the left and click Add > to move them to the Used fields on the right. For this lesson, just select Station (sorted Up), Offset and Cut/Fill to create a simple cut/fill report.
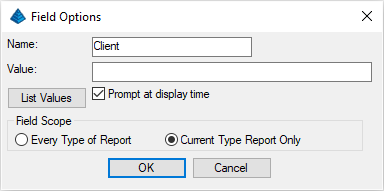
This new user-defined field is added to the list of Available Fields. Click the Add Field button again to set the values as shown below and click OK when ready:
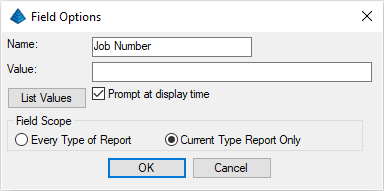
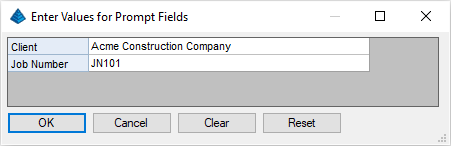
NOTE: Make sure to enable the Prompt at display time toggle. This will cause the program to pause for user input at the time of creating the report.
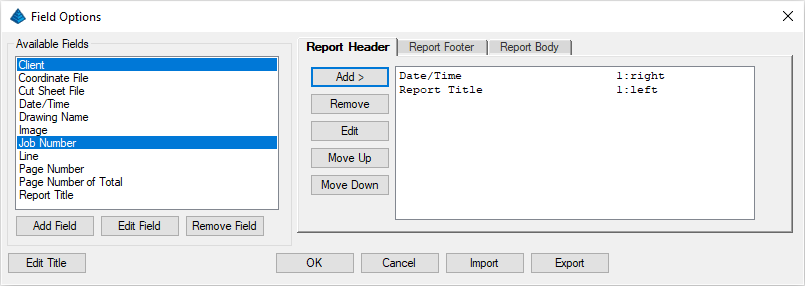
When the fields are moved, you will be prompted to select various format options as illustrated below:
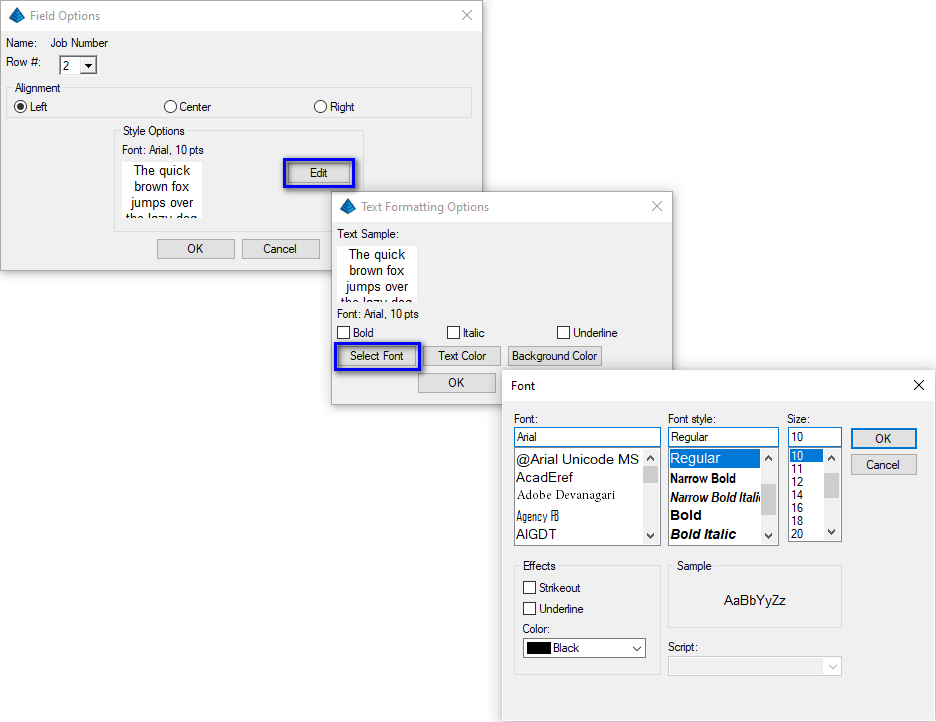
- Client to:
- Row #1
- Center justified
- Bold Font
- 14 pt text size
- Job Number to:
- Row #2
- Left justified
- Regular Font
- 10 pt text size
Click OK when ready.
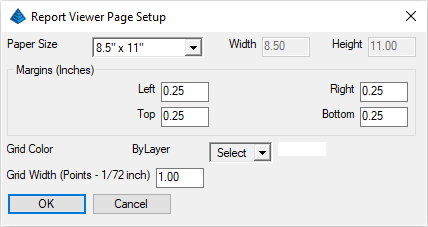
Select an 8.5" x 11" paper size with 0.25" margins all around as shown below and click OK when ready:
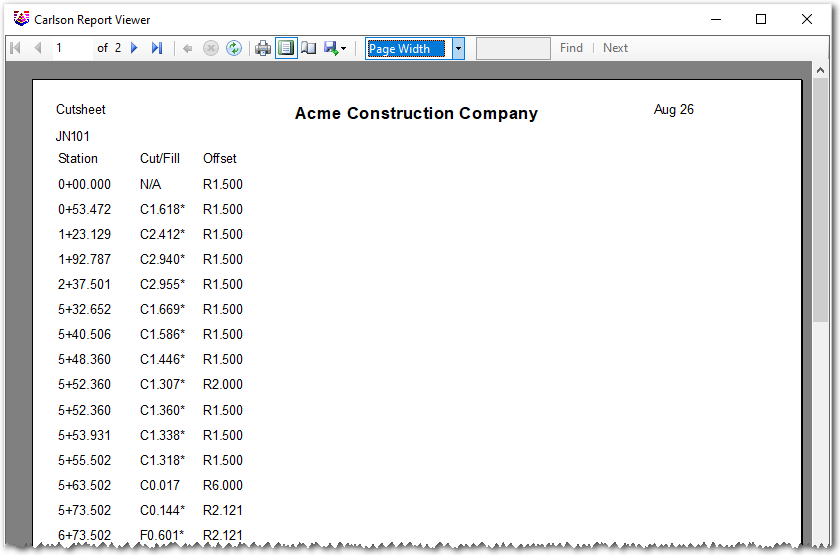
The resulting report is displayed similar to that shown below which can be printed or exported to various formats:
 NOTE: The above process can be repeated for any
number of fields and exported as a *.FMS file for
future use or to develop company or client report standards. Click
the Exit button to dismiss the Report
Formatter dialog box.
NOTE: The above process can be repeated for any
number of fields and exported as a *.FMS file for
future use or to develop company or client report standards. Click
the Exit button to dismiss the Report
Formatter dialog box.
Click File -- Exit to close the command.