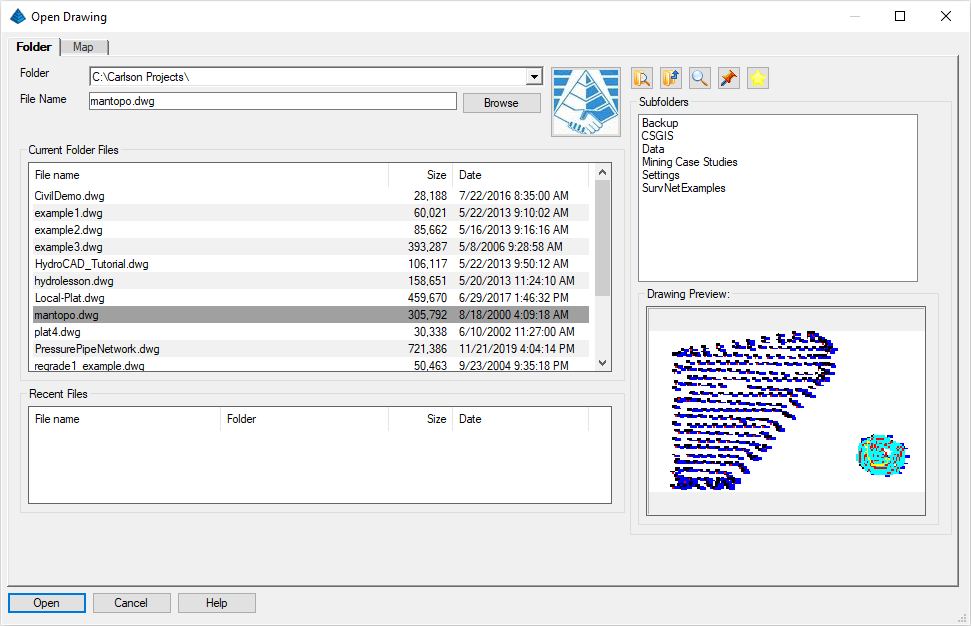
- If you get the Start Page, pick Open Files.
- If you get the Startup Wizard dialog box, click the Browse button.
- If you are taken directly into CAD, click File -- Open.
NOTE: Many of the routines below can also be accomplished with the Carlson Civil and/or Construction modules but our focus herein will presume use of the Survey module.
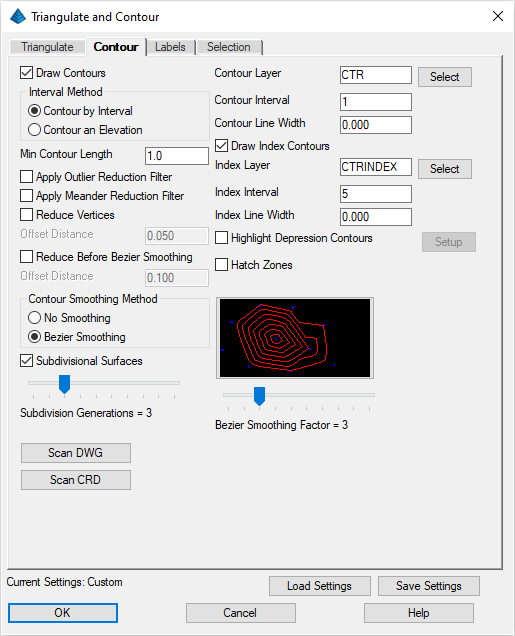
Issue the Surface -- Triangulate & Contour command. The following dialog box (with several "tabs") will appear which you should fill out as discussed below:
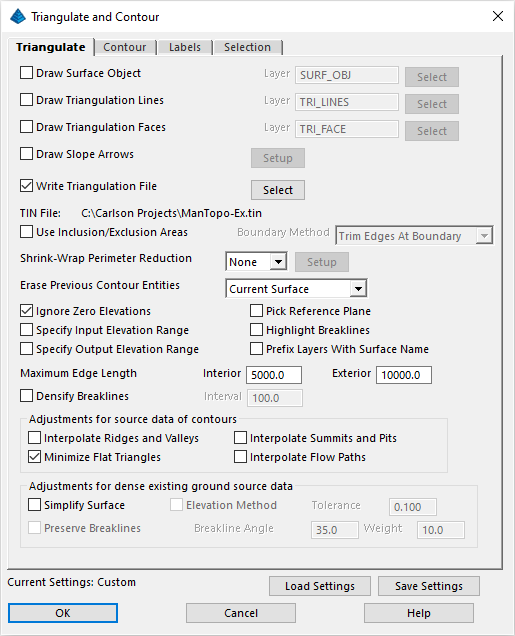
- In the Triangulate tab (as shown above), enable the
Write Triangulation File toggle and click its
Select button to set the name of a triangulation
(*.tin) file as illustrated below:
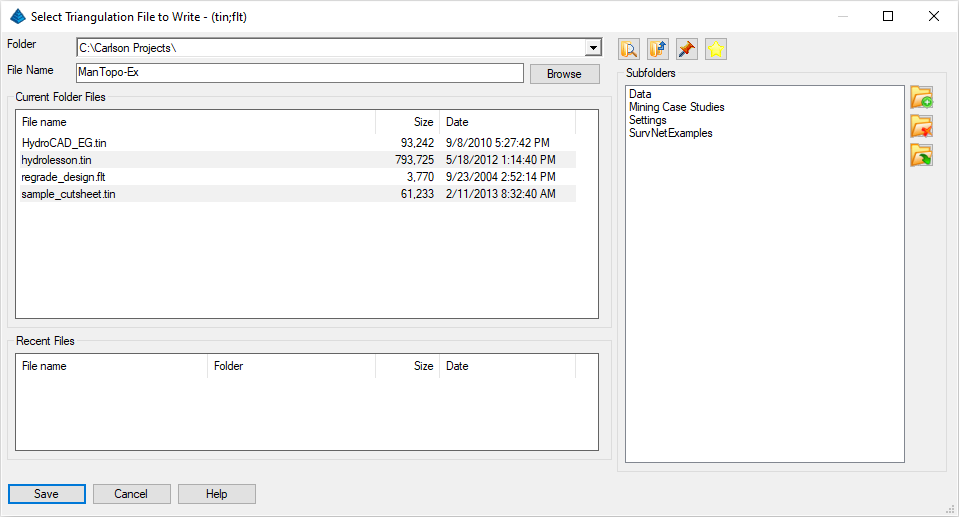
Click the Save button on this dialog box so that the results of the triangulation can be re-used for future purposes. Back in the Triangulate & Contour dialog box, turn off the Use Inclusion/Exclusion Areas toggle and also turn off the various Draw options. Set any remaining options as illustrated above. - In the Contour tab, as shown below, set the
Contour Interval to 1, turn on Draw Index
Contours and set its interval to 5:
Select points and breaklines to Triangulate.
[FILter]/<Select entities>: type ALL and press Enter twice
If a secondary dialog box appears prompting for a coordinate file (*.crd), select Mantopo.crd as your coordinate file and then specify the following default options:
Range of Points: All
Description Match: *
A "TIN" file is written and the contours are drawn. However, notice the unacceptable wavy look around the perimeter, an area which is meant to be a ditch. Let's clean this up through the use of breaklines.
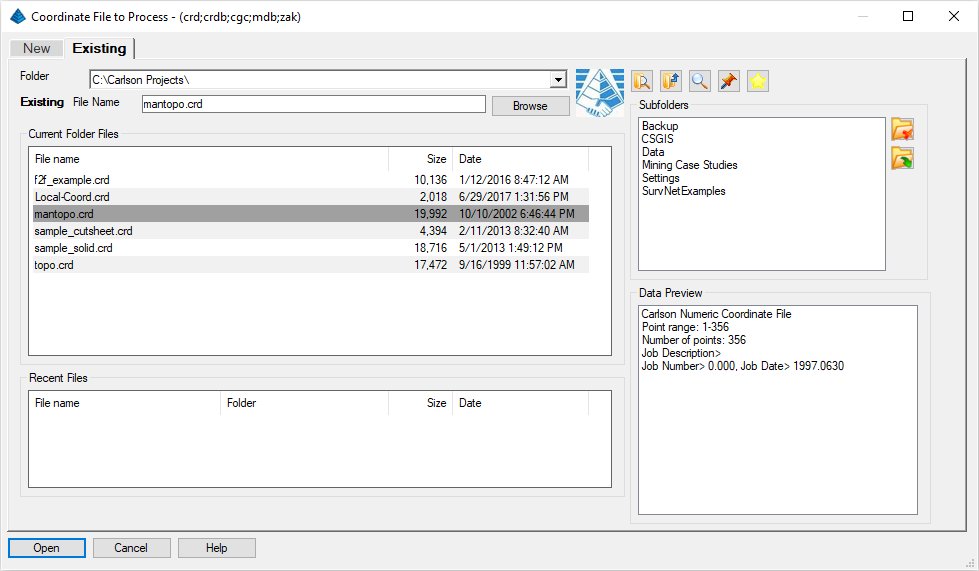
The program will recognize that you have not yet established a coordinate file, so click the Existing tab and pick the File as mantopo.crd as shown below:
Click Open. The Draw Field to Finish dialog appears which may (should) resemble the following:
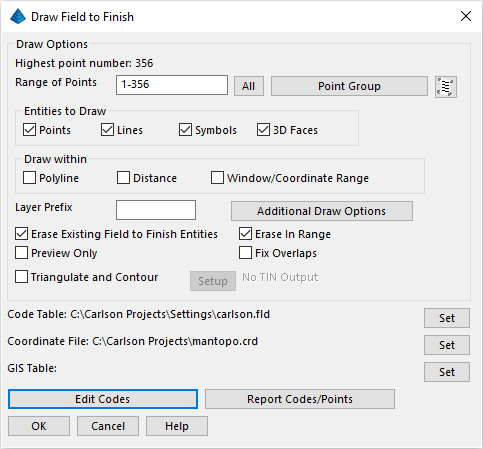
NOTE: You may need to click the Set button to the right of Code Table: to specify/use the "C:\Carlson Projects\Settings\Carlson.fld" file.
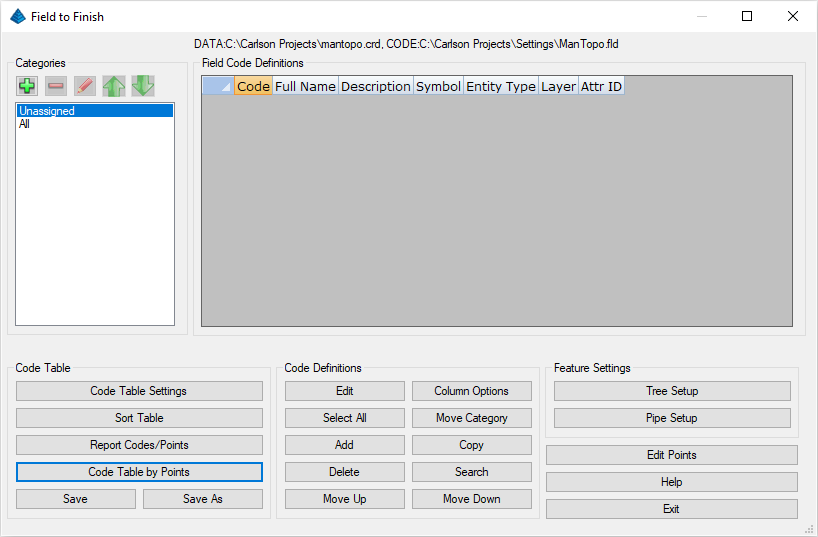
At the lower left of the Draw Field to Finish dialog, click Edit Codes. The Field to Finish dialog appears:
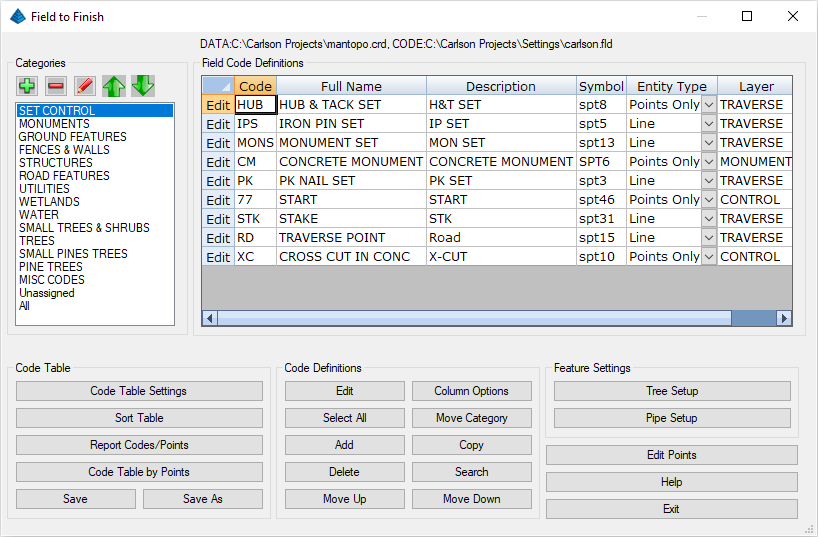
On the left side of the Field to Finish dialog, under the heading Code Table, there is an option called Code Table Settings. Click on it to display this dialog:
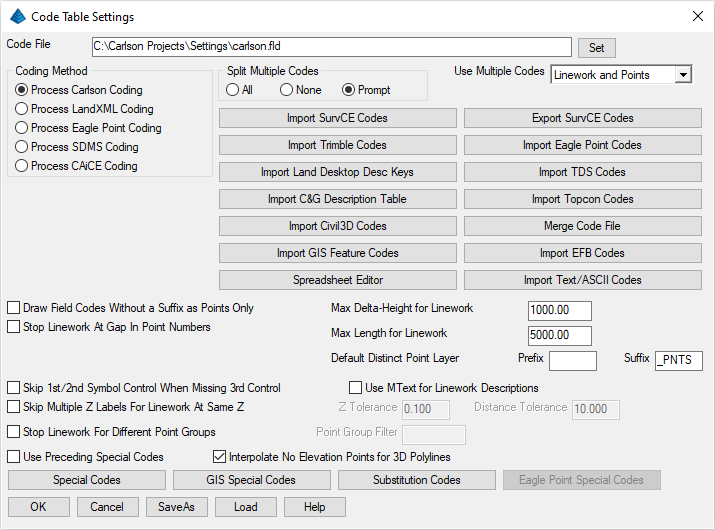
As you can see at the top of the Code Table Settings dialog, the current Field to Finish code definition (.FLD) file is Carlson.fld. We want to make a new code table because the coordinate file for the field survey includes special coding (e.g. 17 and 18) for ditch lines and top of banks.
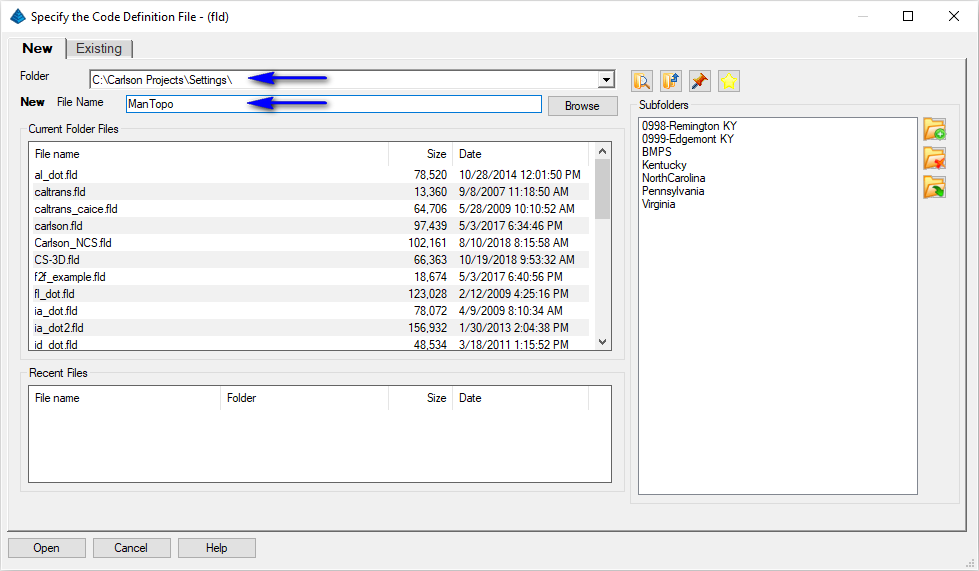
To do this, click Set at the upper-right of the Code Table Settings dialog, then choose the New tab (for new file) and name it ManTopo, as shown below (noting the "\Carlson Projects\Settings" folder):
Click Open. You will be taken to the previous dialog.
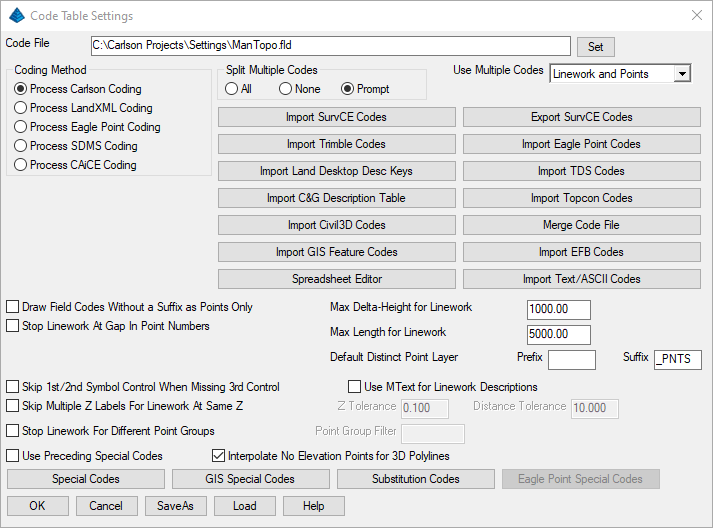
Notice how "C:\Carlson Projects\Settings\ManTopo.fld" is now listed at the top which is our new field code library. Let's also explore some additional capabilities. Click the Special Codes button to display the dialog box below:
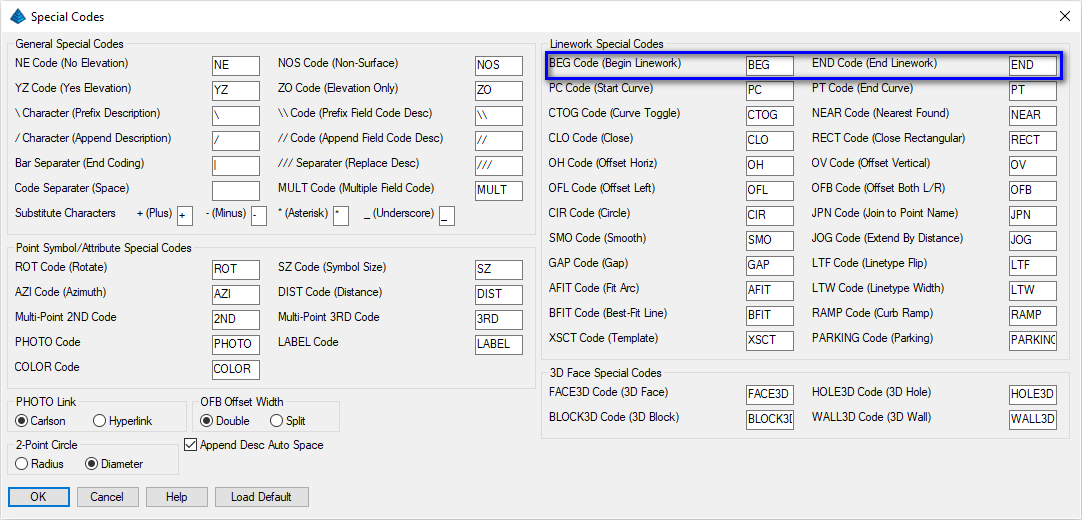
Make note of the BEG Code (Begin Linework) and the END Code (End Linework) special codes. These can be used to indicate special instances in the data set where linework is to begin and/or end, respectively. We'll use the END code later. Click OK to return to the previous dialog box. From it, click OK. You will return to the main Field to Finish table, completely empty, as shown below:
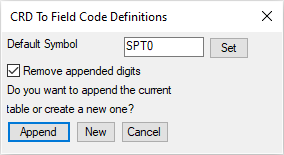
Now, get a jump start on the table by choosing the option Code Table by Points (located in the lower left of the dialog). Choose Append on the subsequent dialog box (shown below).
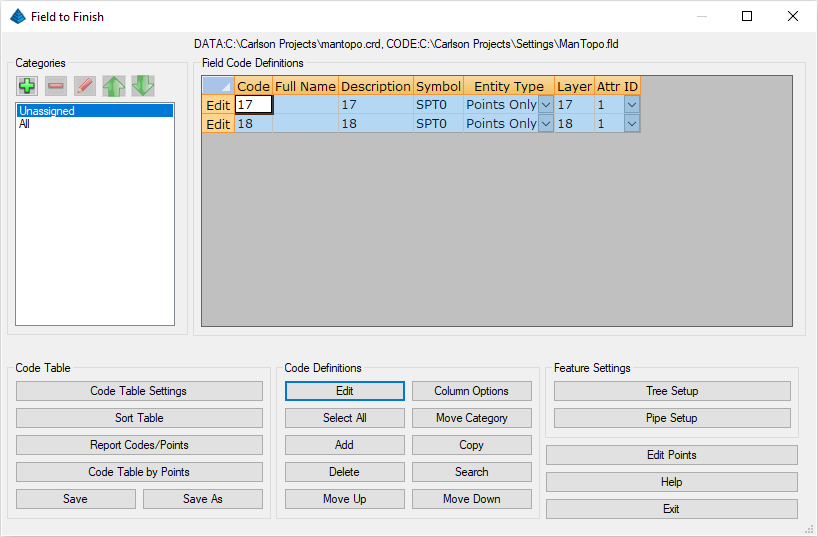
In this lesson, we only care about codes 17 and 18. Select all other codes (the GROUND code in this case) and click the Delete button to remove that Code from the list. Now select Codes 17 and 18 (by holding the CTRL or SHIFT key down while picking or using the Select All button) as shown below:
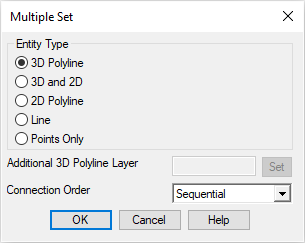
Pick the Edit button under Code Definitions. The Multiple Set dialog appears. Click the Entity button to establish the type of entity that should be drawn for codes 17 and 18 as shown below. Make all settings as shown in this box. We will instruct them to both generate 3D Polylines (which will act as breaklines or barrier lines for contouring). Accept the 3D Polyline choice by clicking OK:
Click the Layout ID button to establish positions and style for the attributes (i.e. Point Number, Elevation and Description) for codes 17 and 18. Specify Attribute Layout ID 5 and click OK. Then click Exit, which will take you back to the Field to Finish dialog. The last steps are to first to save the ManTopo.fld Field-to-Finish by clicking the Save button. Then click Exit (lower right). You will return to the following dialog which allows you to control the details of what to draw:
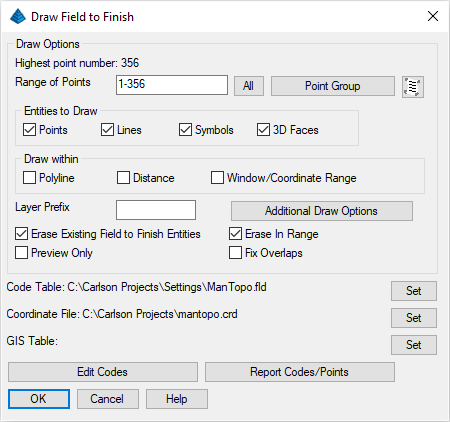
Click the Additional Draw Options button and make sure that the Point Label Settings are set so that you can see the points properly as shown below:
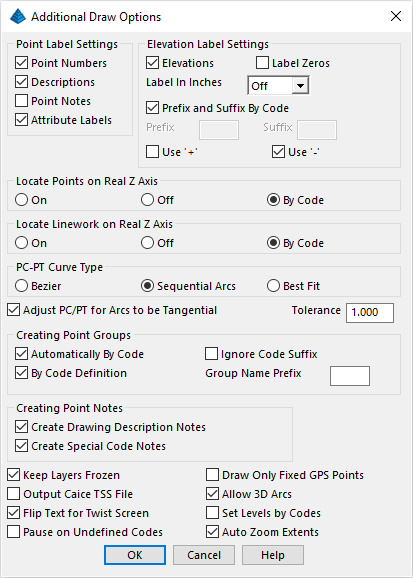
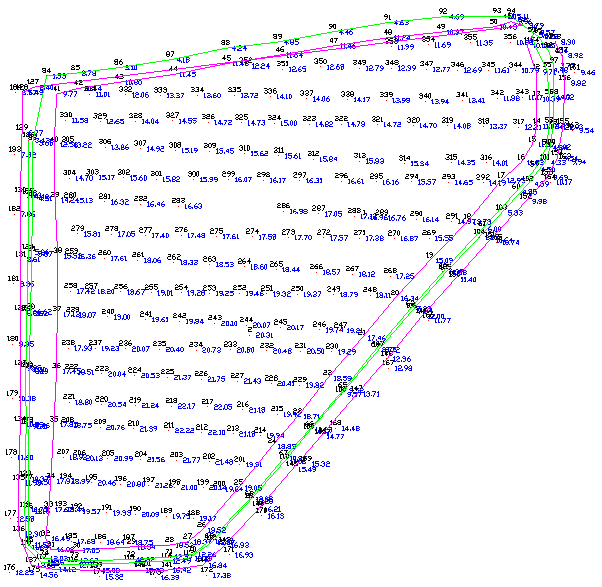
Click OK to both dialog boxes. The following drawing is created. All the ditch lines and top of bank lines, because they were coded 17 and 18, are drawn in one quick procedure (previous contours removed and coloring added for clarity):
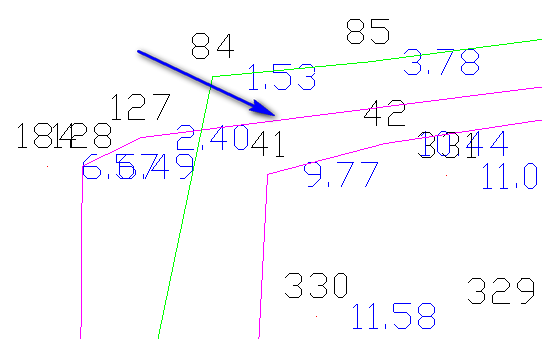
Mode: break polyline at removal
Select polyline segment to remove [Options]: select the polyline segment to the right of point 127 indicated by the arrow below (you will recognize this as a long segment running from point 127 to point 52)
Select polyline segment to remove (Enter to end): press Enter
The problem with this approach is that if the Draw Field to Finish routine is ever re-run (e.g. perhaps due to additional data coming in from the field), the polyline segment would return. We'll address this shortly.
Select points and breaklines to Triangulate.
[FILter]/<Select entities>: type ALL and press Enter twice
NOTE: With breaklines added to the site, you may be alerted of a crossing breakline scenario located at the northeast corner of the site. Use the Zoom To and Zoom In/Out buttons to explore the data geometry at this area of the site. Let's permanently take care of this by modifying the descriptions of two key points... #10 and #52 (and optionally a third point, #94).
Use the Points -- Edit Points command and make the following changes to the Description value:
| Point Number | Old Description | New Description |
|---|---|---|
| 10 | 17 | GROUND |
| 52 | 17 | 17 END |
| 94 | 18 | 18 END |
Re-run the Surface -- Triangulate & Contour command and use the same settings as before and click OK. When prompted:
Select points and breaklines to Triangulate.
[FILter]/<Select entities>: type ALL and press Enter twice
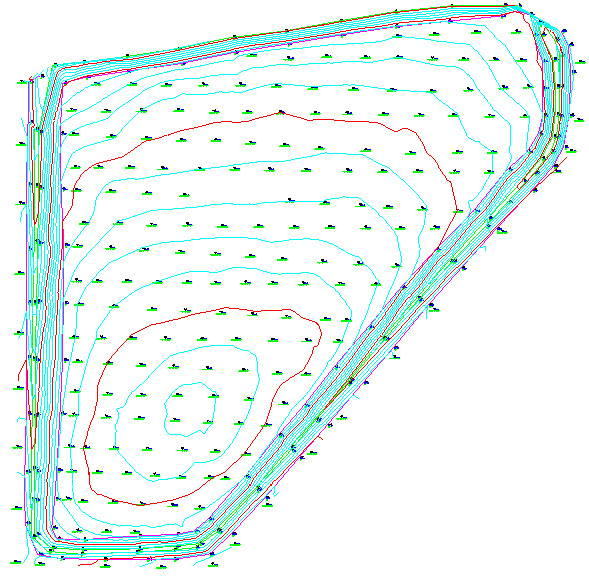
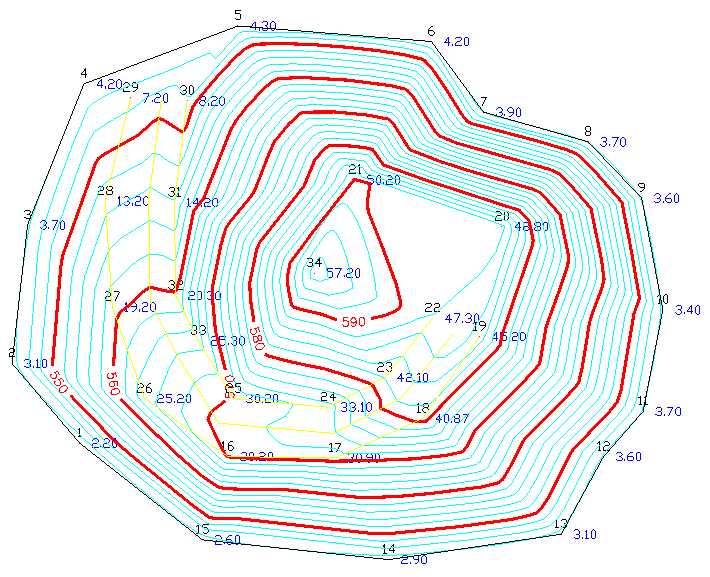
Now we get excellent contours, with a sharply defined ditch. Also note we did not get any processing errors when making the TIN. Use the View -- Freeze Layer by Selection and pick on one of the points (its number or its elevation), and press Enter. The points freeze. Here is the improved drawing, helped out by 3D polylines that were produced by Draw Field-to-Finish:
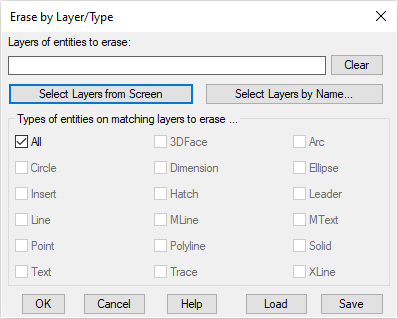
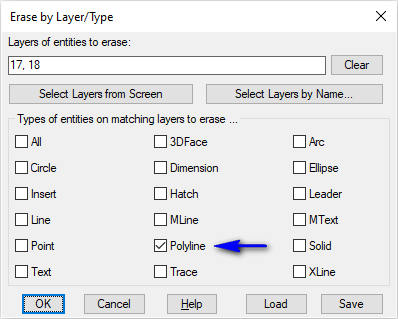
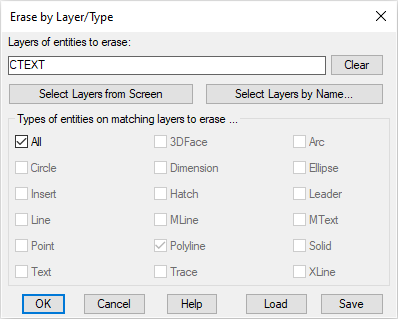
If you know the layer names, you can just type them in. If you know where they are but not their names, then click on Select Layers from Screen. If you'd recognize the layer name if you saw it in a list, click Select Layers by Name. Click on Select Layers by Name and pick 17 and 18, then OK. Set the Entities to Erase as shown below:
Notice the change in the drawing.
[FILter]/<Select entities to explode>: pick the stockpile block
[FILter]/<Select entities to explode>: press Enter
The exploded block reverts into individual components that can be worked on separately. It's also worth noting that while the block has been exploded, its "block definition" still exists in the drawing. This means that now that it's exploded, it is essentially taking up twice the amount of storage space in the drawing. As such, a common practice would be to "purge" (as obtained through the File -- Drawing Utilities -- Purge command.
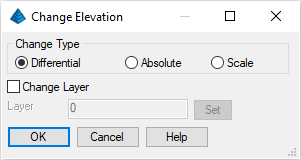
Set the value(s) as shown above and click OK. When prompted:
Positive number increases, negative number decreases elevation.
Elevation Difference <0.00>: -540
Ignore zero elevations [Yes/<No>]? Y
Select Entities for Elevation Change. do a lower right pick to upper left pick selection around the stockpile (automatic crossing)
[FILter]/<Select entities>: press Enter
Notice in the drawing below how the points, breaklines and contour polylines have changed in elevation with the exception of the contour text labels:
Issue the Inquiry -- List Elevation command and pick on an index contour. Notice how the elevation has indeed changed. Reissue the Edit -- Erase -- Erase by Layer command and set the values as shown below to erase the 5 index contour labels which are no longer accurate.
Pick Lower Left limit of surface area: pick below and to the left of the stockpile, but as close as possible to the stockpile without clipping it in the window (you want to totally include it, but with little wasted margin)
Pick Upper Right limit of surface area: pick above and to the right of the stockpile
A dialog appears:
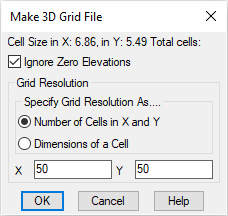
We will stick with the defaults, as shown. Notice that we are using 50 grid cells within our window and since our window was not a perfect square, the cell sizes are not whole numbers. In this example it is 6.86 x 5.49. You may have slightly different sizes. Seeing this, if we wanted a 5 x 5 cell size, we could click the Dimensions of a Cell option and set the size to 5 x 5. Hundreds or thousands of cells in both directions will increase calculation time. You can experiment with larger cells or, if you prefer, smaller cells (which makes more cells). However, you will begin to see diminishing returns in terms of accuracy changes as your cell size continues to shrink. After a while (depending largely on the spacing of the source data), tighter, smaller cell sizes don't add any value to the precision of the calculation. Click OK to display a dialog box similar to that shown below:
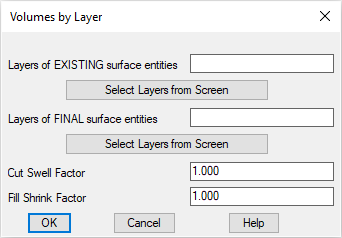
Use the Select Layers from Screen buttons to select entities as outlined as follows:
- Layers of EXISTING surface entities: PERIMETER
- Layers of FINAL surface entities: PERIMETER, BARRIER, CTRINDEX, CTR, PNTS
Select surface entities on corresponding layers.
[FILter]/<Select entities>: do a right-to-left (crossing) selection of the entire stockpile area
[FILter]/<Select entities>: press Enter
Select the Inclusion perimeter polylines or ENTER for none:
[FILter]/<Select entities>: pick the perimeter polyline
[FILter]/<Select entities>: press Enter
Select the Exclusion perimeter polylines or ENTER for none.
[FILter]/<Select entities>: press Enter
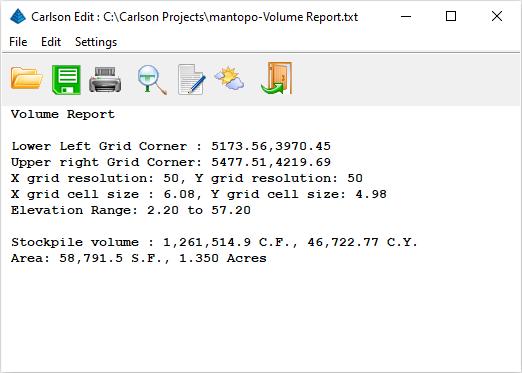
This leads to a flexible reporting and output dialog:
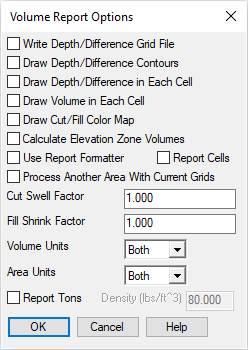
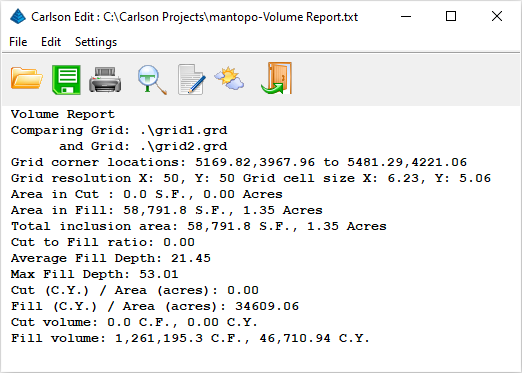
Elevation Zone Volumes, for example, would produce volumes in any desired increment from the base of the stockpile going up. If the stockpile consists of coal (80 lbs/c.f.), then Report Tons can be clicked on and a Density value entered. Click OK and the basic report is produced, as seen below:
Click the Exit (Doorway) button to return to the command prompt.
Select stockpile entities and perimeter.
[FILter]/<Select entities>: crossing select (right-to-left picks) the entire stockpile area
[FILter]/<Select entities>: press Enter
Stockpile Volume Report (dialog): accept the default values and click OK
The grid resolution dialog (note that it is still at 50x50 but the cell dimensions are likely different from before) appears again. Click OK. A report is generated: