The Project Settings dialog box has six tabbed windows:
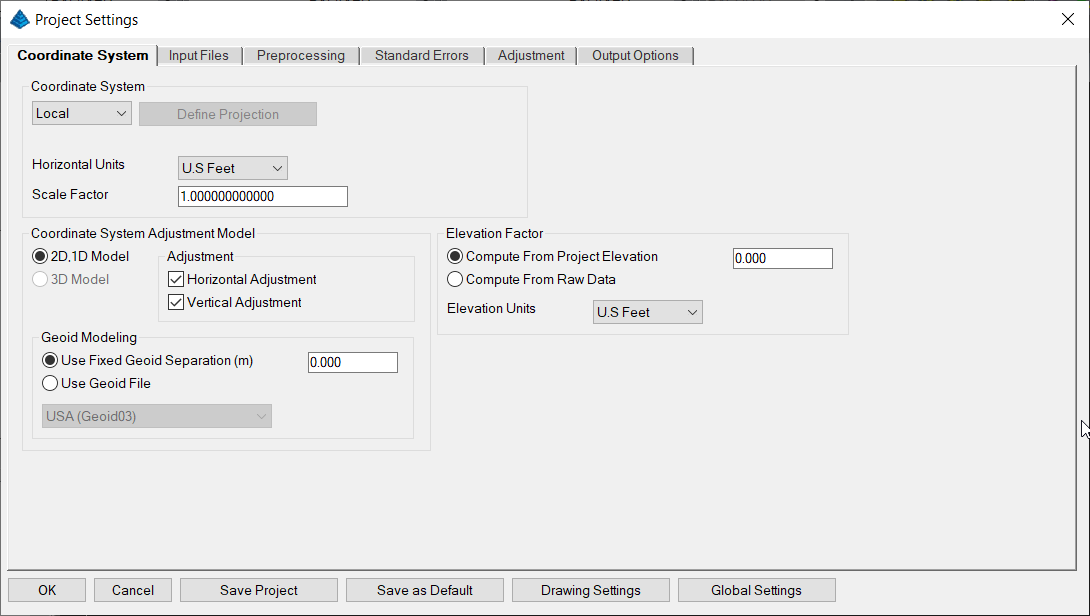
The Coordinate System tab contains settings that relate to the project coordinate system, the adjustment model and other geodetic settings.
You can select either the 3D model or the 2D/1D mathematical model. If you choose 2D/1D mathematical model, you can choose to only perform a horizontal adjustment, a vertical adjustment or both. In the 3D model, both horizontal and vertical are adjusted simultaneously. The 3D model requires that you choose a geodetic coordinate system. Local, assumed coordinate systems cannot be used with the 3D model. GPS vectors can only be used when using the 3D model.
If using the 2D/1D mathematical model, you can select Local (assumed coordinate system), or a geodetic coordinate system such State Plane NAD83, State Plane NAD27, UTM, or a user-defined coordinate system as the coordinate system. When using the 3D model you cannot use a local system.
Select the "Horizontal Units" for output of coordinate values (Meters, US Feet, or International Feet). In the 3D model, both horizontal and vertical units are assumed to be the same. In the 2D/1D model, horizontal and vertical units can differ if you select "Compute from Project Elevation". The "Horizontal Unit" setting in this screen refers to the output units. It is permissible to have input units in feet and output units in meters. Input units are set in the Input Files tab.
If you choose SPC 1983, SPC 1927, or UTM, the appropriate zone will need to be indicated. The grid scale factor is computed for each measured line using the method described in Section 4.2 in the publication by: Stem, James E., (1990) State Plane Coordinate System of 1983. Rockville, MD: NOAA.
If using the 2D/1D model and you select a geodetic coordinate system, you have a choice as to how the elevation factor is computed. You can choose to either enter a project elevation or you can choose to have elevations factors computed for each distance based on computed elevations. In order to use the "Compute Elevation from Raw Data", all HI's and foresight rod heights must be collected for all points.
If you choose a geodetic coordinate system and are using the 2D/1D model, you will want to select "Project Elevation" if any of your raw data measurements are missing any rod heights or instrument heights. There must be enough information to compute elevations for all points in order to compute elevation factors. For most survey projects, it is sufficient to use an approximate elevation, such as can be obtained from a Quad Sheet for the project elevation.
If you are using either the 3D or the 2D/1D adjustment model using non-local coordinate system, you must choose a geoid modeling method. A project geoid separation can be entered or the grid model can be selected from a list of models. The project must fall within the geographic range of the geoid grid files.
Geoid modeling is used as follows. Entering a 0.0 value for the separation is the method to use if you wish to ignore the geoid separation. In the 2D/1D model, it is assumed that elevations entered as control are entered as orthometric heights. Since grid reduction requires the data be reduced to the ellipsoid, the geoid separation is used to compute ellipsoid heights. The difference between using geoid modeling and not using geoid modeling or using a project geoid separation is insignificant for most surveys of limited extents.
In the 3D model, it is also assumed that elevations entered as control are orthometric heights. Since the adjustment is performed on the ellipsoid, the geoid separation is used to compute ellipsoid elevations prior to adjustment. After the adjustment is completed, the adjusted orthometric elevations will be computed from the adjusted ellipsoid elevations and the computed geoid separation for each point.
If you choose one of the geoid models from the list, the geoid separations are computed by interpolation with data points retrieved from geoid separation files. The geoid separation files should be found in the primary the installation directory. Grid files have an extension of .grd. These files can be downloaded from the Carlson website (www.carlsonsw.com). If you pick a geoid model that is not on your computer, SurvNET will automatically connect to the Carlson website and download the specific geoid file.
If you choose to enter a project geoid separation, the best way to determine a project geoid separation is by using the NGS on-line Geodetic Toolkit. Enter a latitude and longitude of the project midpoint and the program will output a project separation.
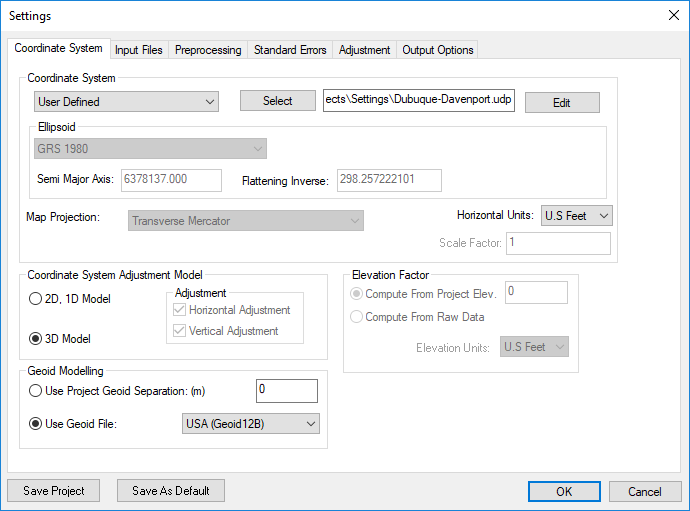
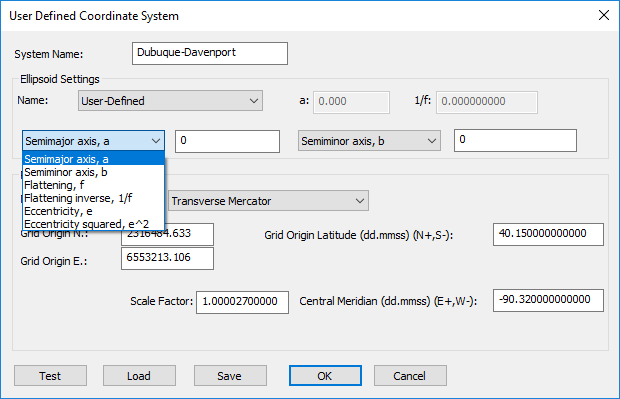
SurvNET allows the creation of user-defined geodetic coordinate systems (UDP). The ability to create user-defined coordinate system allows the user to create geodetic coordinate systems based on the supported projections that are not explicitly supported by SurvNET. A SurvNET user-defined coordinate system consists of an ellipsoid, and a map projection. The ellipsoid can be one of the explicitly supported ellipsoids or a user-defined ellipsoid. The supported map projections are:
User-defined coordinate systems are created, edited, and attached to a project from the Project Settings 'Coordinate System' dialog box. To attach an existing UDP file, *.udp, to a project use the 'Select' button. To edit an existing UDP file or create a new UDP file use the 'Edit' button.
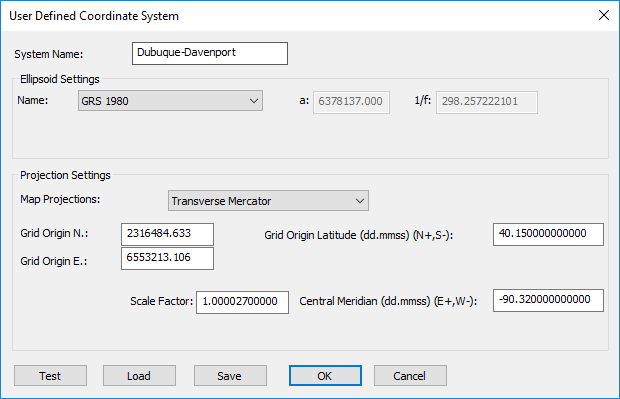
The following dialog box is used to create the user-defined coordinate system. The ellipsoid needs to be defined and the appropriate map projection and projection parameters need to be entered. The appropriate parameter fields will be displayed depending on the projection type chosen.
Note: Grid Origin values for both the Northing and Easting values need to be input in Metric values!
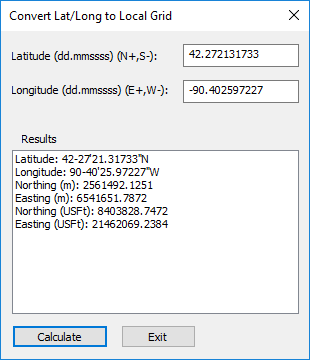
Test - Use the 'Test' button to enter a known latitude and longitude position to check that the UDP is computing correct grid coordinates. Following is the test UDP dialog box. Enter the known lat/long in the top portion of the dialog box then press 'Calculate' and the computed grid coordinates will be displayed in the 'Results' list box:
Load - Use the 'Load' to load the coordinate system parameters from an existing .UDP file.
Save - Use the 'Save' button to save the displayed UDP. The 'Save' button prompts the user to enter the .UDP file name.
OK - Use the 'OK' button to save the UDP using the existing file name and return to the 'Coordinate System' dialog box.
Cancel - Use the 'Cancel' button to return to the 'Coordinate System' dialog box without saving any changes to the .UDP file.
If you need to define an ellipsoid, choose the 'User-Defined' ellipsoid option. With the user-defined ellipsoid you will then have the option to enter two of the ellipsoid parameters.
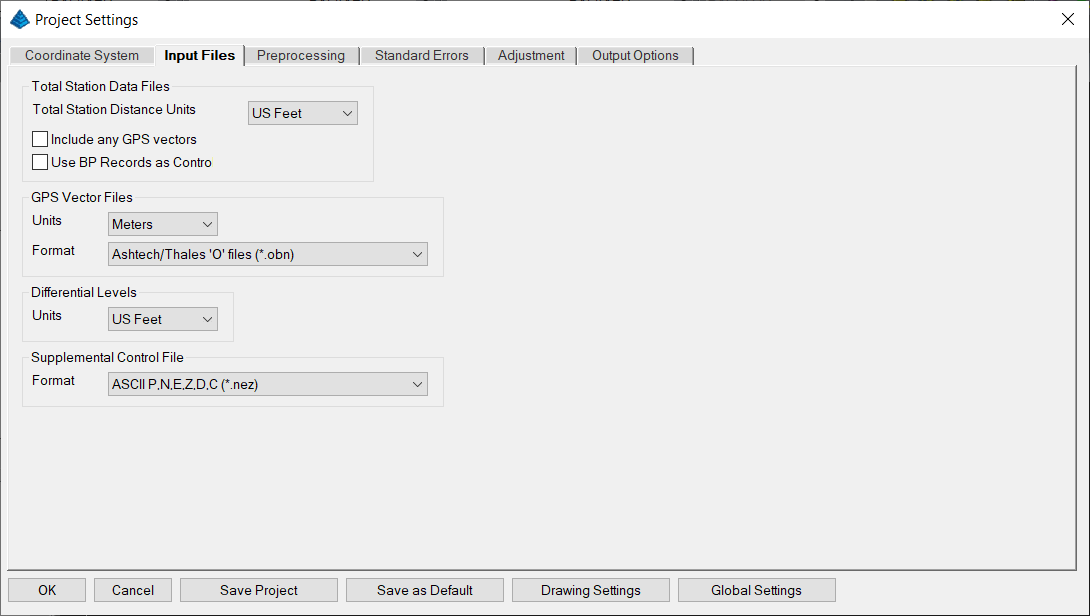
This dialog box is used to set the default parameters for the Input Raw files that will be used for processing the data.
Note that if you are processing Carlson RW5 total station files, you have the option of including GPS vectors that can be collected by SurvCE/SurvPC and stored in the RW5 file. Alternatively, you can select the RW5 file in the GPS vector section. If the "Include any GPS vectors" option in the Total Station Data Files section is checked, you will have the option to use the Base Point records in the RW5 file as control. If "Use BP records as control" is NOT checked, or the RW5 file is selected in the GPS vector section, you must define the control in either the RW5 file as POINT records or in a Supplemental Control File.
GPS Vector Files: GPS vector files can be entered and processed. Both GPS vector files and total station raw files can be combined and processed together. You must have chosen the 3D mathematical model in the Coordinate System tab in order to include GPS vectors in the adjustment.
A variety of popular GPS vector file formats are supported, including (but not necessarily limited to):
The following is a typical vector record in the StarNet ASCII format. GPS vectors typically consist of the 'from' and 'to' point number, the delta X, delta Y, delta Z values from the 'from' and 'to' point, with the XYZ deltas being in the geocentric coordinate system. Additionally the variance/covariance values of the delta XYZ's are included in the vector file.
.GPS WEIGHT COVARIANCE
C PRS34452 1305780.345005 -4667085.299019 4132689.544939 0.005000 0.005000 0.005000 --MON
C UCNJ 1305780.345005 -4667085.299019 4132689.544939 0.00000100 0.00000100 0.00000100 --MON
G1  UCNJ-1000    8399.71318061   -4742.15645068   -8036.07224424 --MNS
G2   3.939428e-006  2.474560e-005  1.160301e-005
G3   3.924536e-006 -3.360765e-006 -1.028503e-006
G1  UCNJ-1001    8328.15569476   -4796.59445569   -8072.25948922 --MNS
G2   9.596618e-007  1.687749e-005  1.936038e-006
G3   1.176891e-007 -8.668020e-009 -4.798408e-006
The first line defines what values are in the G2 and G3 records. It can be either GPS WEIGHT COVARIANCE (G2 is Variance, G3 is Covariance), or GPS WEIGHT STDERRCORRELATION (G2 is standard error, G3 is standard error correlation). This line is optional; the default is COVARIANCE.
The next two lines are coordinate control records. These records are also optional. If used, they must be Geocentric Coordinates (XYZ) in metric units. The format is as follows:
C PointName X Y Z StdErrX StdErrY StdErrZ --PointDescription
The standard errors and point description are optional.
The GO record is a comment.
The G1 record includes the 'from' and 'to' points and the delta X, delta Y, and delta Z in the geocentric coordinate system and an optional description of the rover point.
The G2 record is the variance (or standard error) of X,Y, and Z. The G3 record contains the covariance (or standard error correlation) of XY, ZX, and ZY. Most all GPS vector files contain the same data fields in different formats.
Use the 'Add' button to insert GPS vector files into the list. Use the 'Remove' button to remove GPS vector files from the list. All the files in this list will be used in the least squares adjustments. All the GPS files in the list must be in the same format. If the GPS file format is ASCII you have the option to edit the GPS vector files. The Edit option allows the editing of any of the ASCII GPS files using Notepad. Typically, only point numbers or point descriptions would be edited. The variance/covariance values are used to determine the weights that the GPS vectors will receive during the adjustment and are not typically edited.
Level Raw Files: Differential and Trig level files can be entered and processed. Differential or Trig Level raw files have a .TLV extension and are created using the Carlson Level Editor. The Carlson Level Editor has several Import options that allow you to bring in levels from different formats (e.g. Leica, Trimble, Topcon, etc). You can process level data in the same project with the traverse and GPS vector data but the vertical measurements in the traverse/vectors will be part of the adjustment. If you want to use the elevations calculated ONLY from the level data, you must process it in a separate project after your traverse/vector data has been adjusted. The elevations will be written to the Output Coordinate file. Make sure your point numbers in the level data match the points in the traverse/vector data.
Supplemental Control File: The supplemental control file option allows the user to designate an additional coordinate file to be used as Control. The supplemental control file can be from a variety of different file types, including (but not necessarily limited to):
Note: For additional information on file format pertaining to the file formats above, refer to the Supplemental Control Files section of the documentation.
Note: You will not be allowed to use the same file for supplemental control points and for final output. Least Squares considers all points to be measurements. If the output file is also used as a supplemental control file, then after the project has been processed all the points in the project would now be in the control file and all the points in the file would now be considered control points if the project was processed again. The simplest and most straight-forward method to define control for a project is to include the control coordinates in a raw data file.
The Preprocessing tab contains settings that are used in the preprocessing of the raw data.
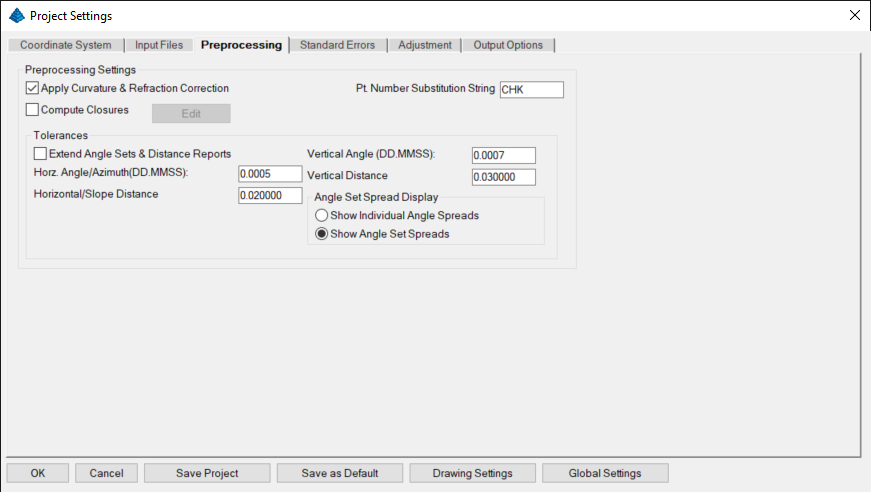
Apply Curvature and Refraction Corrections: Check this box if you wish to have the curvature refraction correction applied in the 2D/1D model when reducing the slope distance/vertical angle to horizontal distance and vertical distance. Curvature/refraction primarily impacts vertical distances.
Pt. Number Substitution String: This option is used to automatically renumber point names. Some data collectors do not allow the user to use the same point number twice during data collection. In Least Squares, it is common to collect measurements to the same point from different locations. If the data collector does not allow you to use the correct point number, this option can be used to automatically renumber these points during processing. For example you could enter the string '=' in the Pt. Number Substitution String. Then if you shot point 1 but had to call it something else such as 101, you could enter '=1' in the description field and during preprocessing point 101 would be renumbered as point '1'.
Compute Closures: Traditional traverse closures can be computed for both GPS and total station traverses. This option has no effect on the computation of final least squares adjusted coordinates. This option is useful for surveyors who, due to statutory requirements, are still required to compute traditional traverse closures and for those surveyors who still like to view traverse closures prior to the least squares adjustment. This option is used to specify a previously created Traverse Closure file.
Tolerances: When sets of angles and/or distances are measured to a point, a single averaged value is calculated for use in the least squares adjustment. You may set the tolerances so that a warning is generated if any differences between the angle sets or distances exceed these tolerances. Tolerance warnings will be shown in the report (.RPT) and the (.ERR) file after processing the data.
If you check the Extended Angle Sets & Distance Report option, all the sets will be shown with the difference between the high angle and low angle, and the difference between the high distance and low distance. If this option is not checked ONLY the sets that exceed the tolerances will be shown in the report.
Horz./Slope Dist Tolerance: This value sets the tolerance threshold for the display of warnings if the difference between highest and lowest horizontal distance exceeds this value. In the 2D model it is the horizontal distances that are being compared. In the 3D model it is the slope distances that are being compared.
Vert. Dist Tolerance: This value sets the tolerance threshold for the display of a warning if the difference between highest and lowest vertical difference component exceeds this value (used in 2D model only).
Horz. Angle Tolerance: This value sets the tolerance threshold for the display of a warning if the difference between the highest and lowest horizontal angle exceeds this value.
Vert. Angle Tolerance: This value sets the tolerance threshold for the display a warning if the difference between the highest and lowest vertical angle exceeds this value (used in 3D model only).
Angle Set Spread Display: You can choose to see the splits of individual angles in each set (2 per set), or just the splits of all the sets combined (high / low angle of all the sets combined).
Some statutes and jurisdictions still require the computation of traditional Traverse Closures. SurvNET gives the surveyor the ability to compute the closures of multiple traverses within a project as part of the preprocessing of the project raw data. Closures for single or multiple traverses can be computed for a single project. Additionally, GPS closures can be computed for GPS loops. To compute closures you must first create a "Closure File" (.CLS). Closure Files define the type of traverse loops that are to be computed and an ordered list of the point numbers comprising the traverse. Since the raw data for SurvNET is not expected to be in any particular order, it is required that the user must specify the points and the correct order of the points in the traverse loop. Both GPS and angle/distance traverses can be defined in a single traverse closure file.
To add a traverse closure file, select Edit from the dialog box.
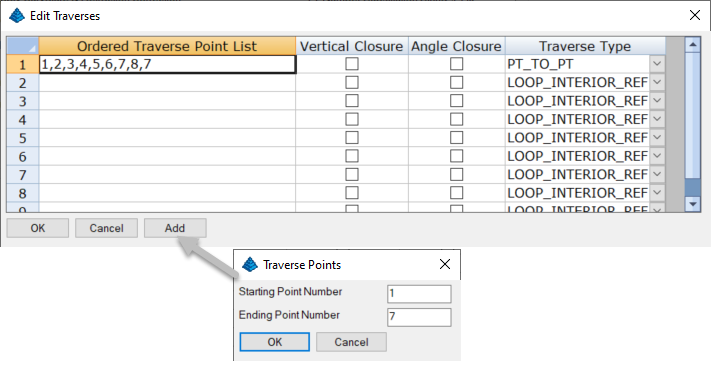
If you need to edit one of the traverses, mouse-click the traverse to be edited. Make the appropriate edit(s), then click the OK button to save the changes.
As an example of traverse point entry, points can be entered in the form:
10,23,30-35,45,23,10
A comma separates the point numbers. You can select a range
(e.g. 30-35) when the points are sequential.
NOTE: You must start with the first backsight point number
and end with the last foresight point number for a loop
traverse.
For example, if you have a simple loop traverse with angle closure using points 1, 2, 3 and 4, it will be entered as "4,1,2,3,4,1" (or 4,1-4,1) where 1 is the first occupied point and 4 is the initial backsight.
You can turn the "Angle Closure" ON or OFF. If the angle closure is ON, you will be shown the total angular error and error per angle point. If the final closing angle was not collected, you can turn "Angle Closure" OFF and only the linear closure will be computed.
You can turn the "Vertical Closure" ON or OFF. If the vertical closure is ON, you will be shown the total vertical distance closure.
In order to calculate the traverse closure, you must select the Traverse Type. It can be:
100,101,2-5 (angle closure example collected)
In the above Point-to-Point list, Pt 100 is the starting backsight
point, Pt. 101 is the starting instrument point. Pt. 4 is (would
be) the ending instrument point and the foresight to the angle
closure point is point 5. If a closing angle was not collected, the
list would look as follows:
100,101,2-4
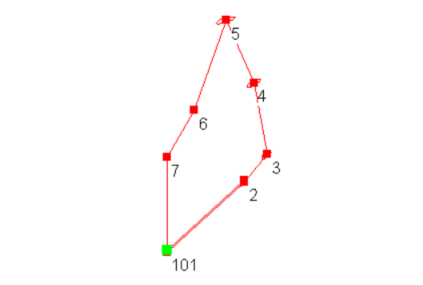
7,101,2-7,101
In the above example, closed loop with angle balance list, point 7
is the backsight point and point 101 is the first occupied point.
If the closing angle 6-7-101 was not collected, the list would be
entered as follows:
7,101,2-7
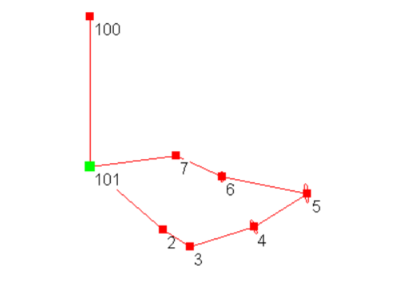
100,101,2-7,101,100
In the above example loop with exterior reference and angle balance
list, point 100 is the backsight point and point 101 is the first
occupied point. If the closing angle 7-101-101 was not collected,
the list would be entered as follows:
100,101,2-7,101
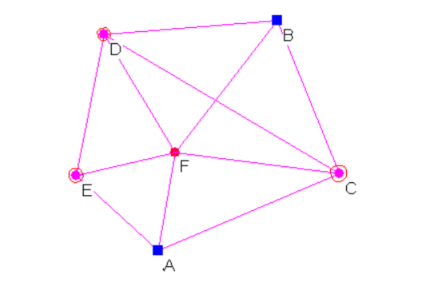
A,E,F,A
In the above example GPS loop, closure will be computed from the
GPS loop going from A-E-F-A.
A,E,D,B
In the above example the closure will be computed from the GPS
traverse going from A-E-D-B. The starting and ending points
MUST be control points.Following is an example of a closed loop traverse report:
Traverse Closures
=================

Traverse points:
103-118,43-44

Traverse starting and ending on different points;
Compute angle closure.
Compute vertical closure.

BS         IP         FS             Angle          FS H. Dist.    FS V. Dist.
 103        104        105            173-07'48.5"     310.4921     -7.7483
 104        105        106            167-48'21.5"     253.4875      5.6291
 105        106        107            200-52'46.0"     381.4923      8.4877
 106        107        108            149-09'05.5"     410.5476    -16.6830
 107        108        109            080-42'36.5"     245.5731      9.4221
 108        109        110            174-21'17.5"     175.3848     -5.6971
 109        110        111            201-42'21.5"     367.0019    -11.8161
 110        111        112            171-52'54.5"     237.7809      7.5346
 111        112        113            192-32'53.5"     368.8402     -7.0329
 112        113        114            171-30'59.0"     338.0028    -19.1945
 113        114        115            184-54'03.5"     344.5010     16.3157
 114        115        116            149-20'19.5"     353.8460      7.5562
 115        116        117            202-19'01.5"     390.1123     -9.9180
 116        117        118            112-36'32.0"     293.9935      2.0060
 117        118        43             146-06'36.5"     411.3680     -7.7112
 118        43         44             270-04'01.5"

Closing Az:           S 47-39'47.8"W
Computed Closing Az:  S 47-39'51.3"W

Total angular error:      000-00'03.5"
Angular error per point:  000-00'00.2"


Correct Ending Coordinates, North: 1400952.0140 East: 2241884.7010
Ending Coordinates, North: 1400951.7936 East: 2241884.8160
Error, N: -0.2204 E: 0.1150 Total: 0.2486 Brg:  N 27-33'06.7"W
Distance Traversed: 4882.4241 Closure: 1: 19643

Correct Ending Elevation:  948.1710
Ending Elevation:          948.1203
Elevation Error:            -0.0507


Closure After Angle Adjustment

 103        104        105            173-07'48.3"     310.4921     -7.7483
 104        105        106            167-48'21.3"     253.4875      5.6291
 105        106        107            200-52'45.8"     381.4923      8.4877
 106        107        108            149-09'05.3"     410.5476    -16.6830
 107        108        109            080-42'36.3"     245.5731      9.4221
 108        109        110            174-21'17.3"     175.3848     -5.6971
 109        110        111            201-42'21.3"     367.0019    -11.8161
 110        111        112            171-52'54.3"     237.7809      7.5346
 111        112        113            192-32'53.3"     368.8402     -7.0329
 112        113        114            171-30'58.8"     338.0028    -19.1945
 113        114        115            184-54'03.3"     344.5010     16.3157
 114        115        116            149-20'19.3"     353.8460      7.5562
 115        116        117            202-19'01.3"     390.1123     -9.9180
 116        117        118            112-36'31.8"     293.9935      2.0060
 117        118        43             146-06'36.3"     411.3680     -7.7112
 118        43         44             270-04'01.3"

Closing Az:           S 47-39'47.8"W
Computed Closing Az:  S 47-39'47.8"W

Total angular error:      000-00'00.0"
Angular error per point:  000-00'00.0"


Correct Ending Coordinates, North: 1400952.0140 East: 2241884.7010
Ending Coordinates, North: 1400951.7739 East: 2241884.8363
Error, N: -0.2401 E: 0.1353 Total: 0.2756 Brg:  N 29-24'26.1"W
Distance Traversed: 4882.4241 Closure: 1: 17715
Following is an example of a GPS loop closure report:
Traverse Closures
=================
GPS Loop Points:
A,E,F,A
GPS Loop Closure;
  Misclosure, X:  -0.0323   Y:  -0.0162   Z:  -0.0105
  Closure error:    0.0376   Perimeter: 20229.3858
  Precision: 1:537594
GPS Loop Points:
C,F,D,B,C
GPS Loop Closure;
  Misclosure, X:  -0.0121   Y:  -0.0101   Z:   0.0002
  Closure error:    0.0158   Perimeter: 41332.9807
  Precision: 1:2622216
GPS Loop Points:
F,D,B,F
GPS Loop Closure;
  Misclosure, X:  -0.0022   Y:  -0.0044   Z:   0.0097
  Closure error:    0.0109   Perimeter: 30814.5047
  Precision: 1:2833226
SurvNET provides the ability to generate reports that give the surveyor the information needed to determine if the survey is within ALTA positional tolerances. It is required that the user define which points are to be included in the ALTA testing. The points to be included for ALTA testing are defined in an .ALT file.
There are two options in the File menu that are used to create and edit the ALTA files:
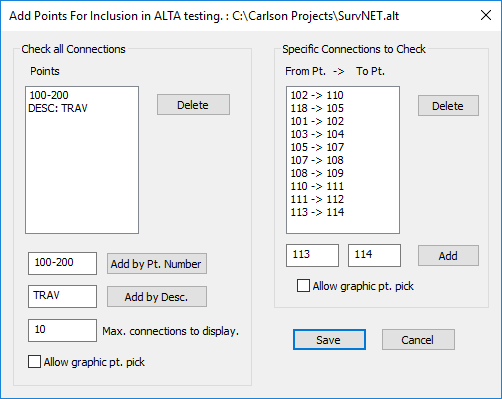
The above dialog box allows the user to define the points to be included in the ALTA report processing.
Notice that you can enter points based on Descriptions in the left-hand list box. For example, if you wished to check connections between all points with TP, EIP, MON descriptions, enter the descriptions in the edit field and press the Add by Desc. button. If TP, EIP, and MON represented Traverse Points, Existing Iron Pipes and Monuments (respectively), then ALTA testing would be performed on those point types.
After you have created the .ALT point file, you need to set some additional Project Settings. The Adjustment tab within the Project Settings, has a Relative Error Ellipses/ALTA Report section where the ALTA report settings are located. These settings define the ALTA Tolerances, specify the .ALT file to be used, and define the type of reporting to be generated.
Note: The Rel. Err. Points File check box must be checked, and an .ALT file must be chosen to get an ALTA report. The .ALT file defines which points will be included in the ALTA reporting. Also note typical ALTA specifications define their positional standard as 0.07 plus 50 PPM.
There are two sections in the .RPT file created through the ALTA reporting. The following report shows the sections of the ALTA report generated by the data in the dialog box.
The first section of the report displays the Relative Error Ellipses between points in the Specific Connection list. All the connections will be displayed whether they pass or fail the ALTA certification. The point sequences used in this section come from the list on the right-hand side of the above dialog box.
The second section of the report performs an ALTA tolerance test on the points in the "Check all Connections" list. Every possible connection between the points listed will be checked. In this section, only the worst connections will be shown. The number of connections shown is determined by the "Max. connections to display" value in the above dialog box. The point sequences used in this section come from the list on the left-hand side of the above dialog box.
An asterisk (*) will be placed beside each connection shown in the report that does not pass based on the confidence interval, tolerance and PPM (parts per million) settings in the Adjustment section of the Project Settings.
The following is a sample ALTA report:
Relative Error and ALTA Tolerances
==================================
SPECIFIC CONNECTIONS: Tolerance of 0.070 +  50 PPM. at the 95% CI.

                                        Actual       Allowable   Ratio
 Sta.       Sta.           Dist.        Semi Major   Semi Major  Actual/Allowable  Semi Minor  Max. Err. Az.
 27         500          204.5030      0.0793       0.0802      0.9890            0.0588       S 85-06'32.2"E
 500        502           66.8572      0.1132       0.0733      1.5432            0.0842       S 86-05'06.7"E *
 34         36           237.9748      0.0731       0.0819      0.8920            0.0731       N 00-00'00.0"E
ALL CONNECTIONS: Tolerance of 0.070 +  50 PPM. at the 95% CI.
All possible connections between the following points were checked:
505,506,507,508,509,510,511,512,513,514,515,516,517,518,519,520,521,522,523,524,525,550,551,552,553,554,555,556,
557,558,559,560

1225 connections tested, the 10 largest relative error ellipses will be shown:
                                        Actual       Allowable   Ratio
 Sta.       Sta.           Dist.        Semi Major   Semi Major  Actual/Allowable  Semi Minor  Max. Err. Az.
 506        556          806.5402      1.0818       0.1103      9.8054            0.2586       S 86-37'40.4"E
 507        556          827.2364      1.0832       0.1114      9.7268            0.2446       S 86-37'05.9"E
 505        556          818.7994      1.0779       0.1109      9.7158            0.2386       S 86-48'24.5"E
 508        556          854.9436      1.0836       0.1127      9.6108            0.2477       S 86-38'39.4"E
 509        556          880.6338      1.0848       0.1140      9.5129            0.2489       S 86-45'39.4"E
 521        556          798.2729      1.0387       0.1099      9.4500            0.2318       S 87-22'50.2"E
 512        556          793.0518      1.0334       0.1097      9.4245            0.2127       S 87-21'38.9"E
 517        556          907.2084      1.0856       0.1154      9.4106            0.2379       S 87-07'38.4"E
 510        556          918.6572      1.0861       0.1159      9.3682            0.2525       S 86-52'46.5"E
 516        556          935.1194      1.0885       0.1168      9.3228            0.2426       S 87-22'21.7"E
*** All connection combinations passed ***
The first part of the report labeled "Specific Connections" will show all selected connections whether they passed or failed. If a connection failed, an asterisk (*) will be placed at the end of the line.
The second part of the report, labeled "All Connections" will only show the connections that "failed" (we chose to see the worst 10).
If all the connections pass in the Specific Connection section, you will also see this message in the report:
*** All Specific Connections passed ***
If all the connections pass in the All Connections section, you will not see any Error Ellipses. You will see the following message:
*** All connection combinations passed ***
Standard errors are the expected measurement errors based on the type equipment and field procedures being used. For example, if you are using a 5 second total station, you would expect the angles to be measured within +/- 5 seconds (Reading error).
The Distance Constant, PPM settings, and Angle Reading should be based on the equipment and field procedures being used. These values can be obtained from the published specifications for the total station. Or, the distance PPM and constant can be computed for a specific EDM by performing an EDM calibration using an EDM calibration baseline.
Survey methods should also be taken into account when setting standard errors. For example, you might set the target centering standard error higher when you are sighting a held prism pole than you would if you were sighting a prism set on a tripod.
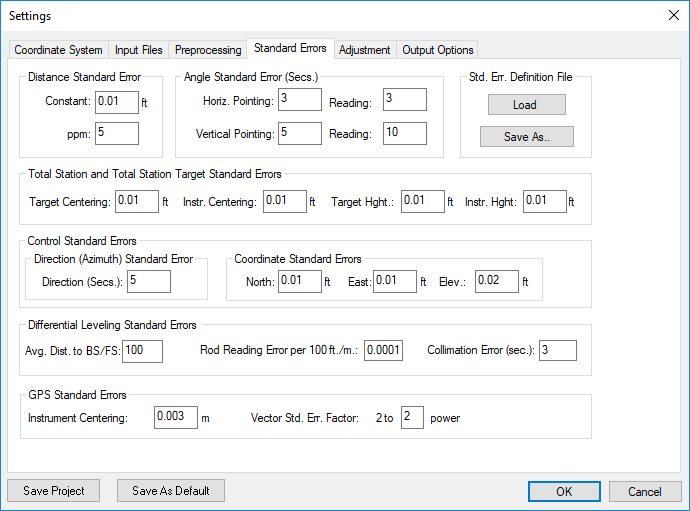
The settings from this dialog box will be used for the Project Default settings. These default Standard Errors can be overridden for specific measurements by placing SE records directly into the Raw Data File.
If the report generated when you process the data shows that generally you have consistently high standard residuals for a particular measurement value (angles, distances, etc.), then there is the chance that you have selected standard errors that are better than your instrument and methods can obtain. (See explanation of report file). Failing the chi-square test consistently is also an indication that the selected standard errors are not consistent with the field measurements.
You can set the standard errors for the following:
Distance Constant: Constant portion of the distance error. This value can be obtained from published EDM specifications, or from an EDM calibration.
Distance PPM: Parts per million component of the distance error. This value can be obtained from published EDM specification, or from an EDM calibration.
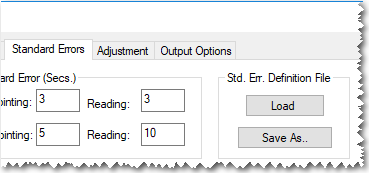
Horizontal Angle Pointing: The horizontal angle pointing error is influenced by atmospheric conditions, optics, experience and care taken by instrument operator.
Horizontal Angle Reading: Precision of horizontal angle measurements, obtain from theodolite specifications.
Vertical Angle Pointing: The vertical angle pointing error is influenced by atmospheric conditions, optics, experience and care taken by instrument operator.
Vertical Angle Reading: Precision of vertical angle measurements, obtain from theodolite specifications.
Target Centering: This value is the expected amount of error in setting the target or prism over the point.
Instrument Centering: The expected amount of error in setting the total station over the point.
Target Height: The expected amount of error in measuring the height of the target.
Instrument Height: The expected amount of error in measuring the height of the total station.
Direction (Bearing / Azimuth): The estimated amount of error in the bearing / azimuth (direction) found in the azimuth records of the raw data.
North, East, Elev: The estimated amount of error in the control north, east and elevation values. You may want to have different coordinate standard errors for different methods of obtaining control. For example, standard errors of control derived from RTK GPS would be higher than control derived from GPS static measurements.
Instrument Centering: This option is used to specify the error associated with centering a GPS receiver over a point.
Vector Standard Error Factor: This option is
used as a factor to increase GPS vector standard errors as found in
the input GPS vector file. Some people think that the GPS vector
variances/covariances as found in GPS vector files tend to be
overly optimistic. This factor allows the user to globally increase
the GPS vector standard errors without having to edit the GPS
vector file. A factor of 0 is the default value and results in no
change to the GPS vector standard errors as found in the GPS vector
file. Acceptable values are 0 through 9. It is not a linear
progression. The actual multiplication factor is the
number 2 raised to the power entered in the factor box. For
example, if the value of 4 is entered, the multiplication factor
will be 2 to the 4th power or 16.
The Vector Standard Error is 2 to the Power of x as shown
below:
0 = original value from GPS
1 = x2
2 = x4
3 = x8
4 = x16
A way to determine the proper factor to use for your specific
make and model of GPS equipment is to perform a GPS only survey
without mixing in Total Station. Then process with a different
factors and check the Chi-Square result that falls closest to the
middle of the range.
These setting only effect level data and are not used when processing total station or GPS vector files.
Avg. Dist. To BS/FS: This option is used to define the average distance to the backsight and foresight during leveling.
Rod Reading Error per 100 ft./m: This option is used to define the expected level reading error.
Collimation Error: This is the expected differential leveling collimation error in seconds.
The Standard error settings can be saved and then later reloaded into an existing or new project. Creating libraries of standard errors for different types of survey equipment or survey procedures is convenient method of creating standards within a survey department that uses a variety of equipment and performs different types of surveys.
Standard error library files (.sef) can be created two ways. From the 'Settings -- Standard Errors' tab, the 'Load' button can be used to import an existing .SEF file into the current project. A .SEF file can also be created from the existing project standard errors by using the 'Save As..' button.
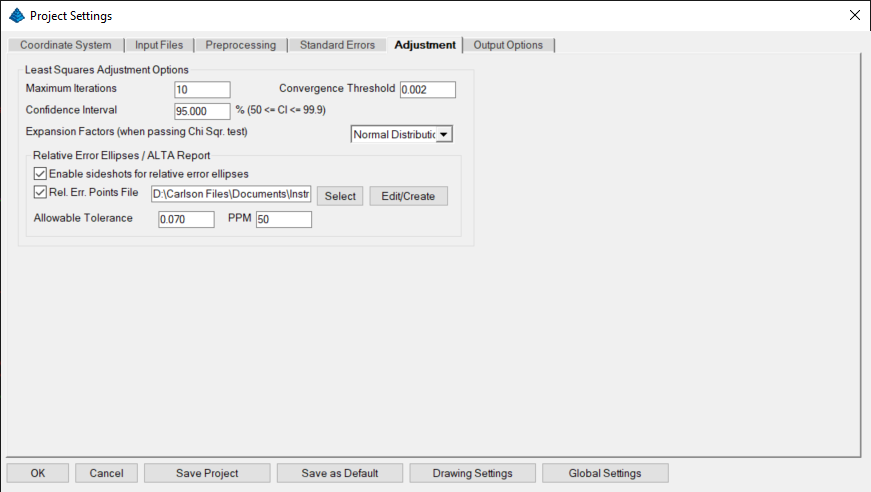
Maximum Iterations: Non-linear least squares is an iterative process. The user must define the maximum number of iterations to make before the program quits trying to find a converging solution. Typically if there are no blunders in the data, the solution will converge in less than 5 iterations.
Convergence Threshold: During each iteration, corrections are computed. When the corrections are less than the threshold value, the solution has converged. This value should be somewhat less than the accuracy of the measurements. For example, if you can only measure distances to the nearest 0.01' then a reasonable convergence threshold value would be 0.005'.
Confidence Interval: This setting is used when
calculating the size of error ellipses, and in the Chi²
(Chi-square) testing. For example, a 95% confidence interval means
that there is a 95% chance that the error is within the tolerances
shown.
Expansion Factors (when passing Chi Sqr. test): This
setting allows users to choose between a normal distribution or F
distribution for error ellipses on points that pass the Chi Square
Test.
Enable sideshots for relative error ellipses: Check this box if you want to see the error ellipses and relative error ellipses of sideshots. This check-box must be set if you want to use the "relative error ellipse inverse" function with sideshots. When unchecked, this toggle filters out sideshots during the Least Squares processing. Since the sideshots are excluded from the Least Squares processing, error ellipses cannot be computed for these points. When this toggle is off, the sideshots are computed after the network has been adjusted. The final coordinate values of the sideshots will be the same regardless of this setting.
Relative Err. Points File: Any certification specifying "Positional Tolerance", "Positional Accuracy" or "Positional Precision" deal with the relative error between specified points. The ALTA standards require that surveyors certify to the relative positional tolerance between points. Relative error ellipses are an accepted method of determining the relative positional error required by the ALTA standards. The points that are to be included in the relative error checking are specified by the user. These points are defined in an ASCII file with an extension of .ALT. To select an .ALT file for relative error checking use the 'Select' button and then browse to the location of the file. Refer to the Creating ALTA Tolerance Reports for a discussion on creating the .ALT file.
If the Relative Err. Points File box is checked, an ALTA section will be created in the report.
Allowable Tolerance, PPM: These fields allow the user to set the allowable error for computations. Typically the user would enter the current ALTA error standards. Many States are adopting similar certifications to the ALTA standards. These certifications may have different tolerances depending on the type of survey (for example rural vs. urban). Make sure the appropriate tolerance and PPM (parts per million) values have been defined. The ALTA standards define their positional standard as 0.07' plus 50 PPM and typically require that the computations be performed to a 95% confidence. The confidence interval is set in the Confidence Interval edit field.
Refer to the discussion on creating and interpreting the ALTA report.
These settings apply to the output of data to the report and coordinate files.
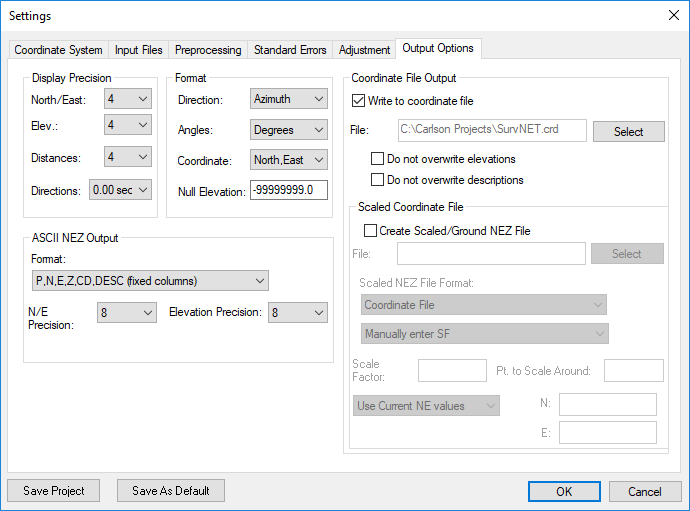
These settings determine the number of decimal places to display in the reports for the following types of data. The display precision has no effect on any computations, only the display of the reports.
These settings determine the format for the following types of data.
Direction - Choose either bearings or azimuth for direction display. If the angle units are degrees, bearings are entered as QDD.MMSSss and azimuths are entered as DDD.MMSSss. If the angle units are grads, bearings are input as QGGG.ggggg and azimuths are input as GGG.ggggg.
Angles - Choose the units you are working in: degrees or gradians.
Coordinate - Choose the order of coordinate display, either north-east or east-north.
Null Elevation - Choose the value for null elevations in the output ASCII coordinate NEZ file. The Null Elevation field defaults to SurvNET's value for NO ELEVATION. This is used to differentiate between NO ELEVATION (a true 2D point) and ZERO ELEVATION (which is a vaild elevation).
Coordinate File Output
These settings determine the type and format of the output NEZ file. An ASCII .NEZ and .OUT files are always created after processing the raw data. The .OUT file will be a nicely formatted version of the .NEZ file. The .NEZ file will be an ASCII file suitable to be input into other programs. There are a variety of options for the format of the .NEZ file. Following are the different ASCII file output options.
You can also set the output precision of the coordinates for the ASCII output file. This setting only applies to ASCII files, not to the C&G or Carlson binary coordinate files which are stored to full double precision.
* N/E Precision: number of places after the decimal to use for North and East values (0 -- 8) in the output NEZ ASCII file.
* Elevation Precision: number of places after the decimal to use for Elevation values (0 -- 8) in the output NEZ ASCII file.
Write to Coordinate File: If you want to write the calculated coordinates directly to a Carlson-supported coordinate file, check the "Write to Coordinate File" box and select the file. You can choose the type of Carlson .CRD or CRDB/C&G file to be created when you 'select' the file to be created. You may wish to leave this box unchecked until you are satisfied with the adjustment. Specifying the File Extension will govern the type of file being created.
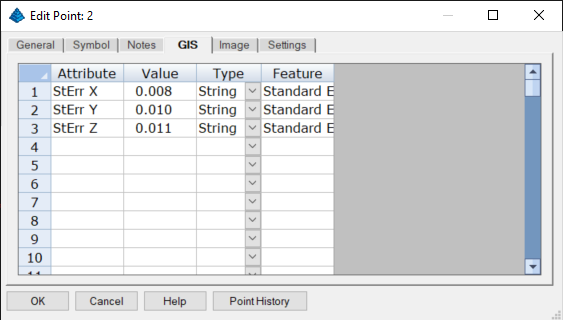
Note: if you use the Carlson CRDB file format, you
are allowed to store attributes for each point as well as the
standard Point Number, Northing, Easting, Elevation and
Description. If this option is used when processing a SurvNET least
squares adjustment, the standard error results will be stored for
each point.
There are two check-boxes below the Output File edit box:
Overwriting exiting points:
* NOTE: After the adjustment the coordinates will be written to the selected output file. If coordinate points already exist in the coordinate file, before a point is written, you will see the following "Point Protection" dialog box:
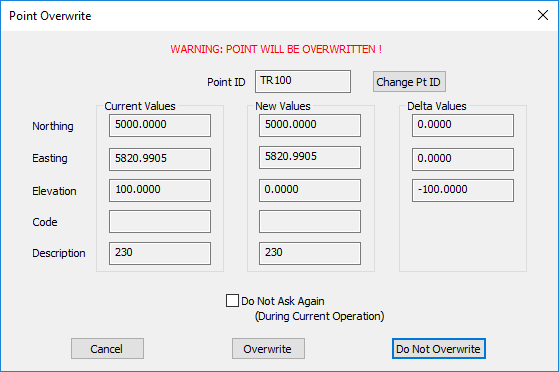
Cancel: Cancel the present operation. No more points will be written to the coordinate file.
Overwrite: Overwrite the existing point. Notice that if you check the 'Do Not Ask Again' box, all further duplicate points will be overwritten without prompting.
Do not Overwrite: The existing point will not be overwritten. Notice that if you check the 'Do Not Ask Again' box, all further duplicate points will automatically not be overwritten - only new points will be written.
Scaled Coordinate File: You are also allowed to output coordinates to a second, scaled or ground, coordinate file. Check the "Create Scaled/Ground NEZ file" box (see below):
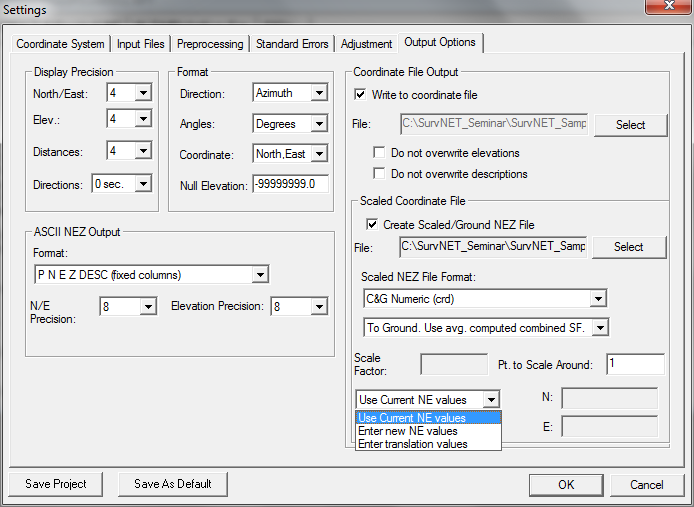
If you are working with a Local coordinate system as defined in the Coordinate System tab, you will only be allowed to manually enter a scale factor. You can select the output file format and the output file.
If you are working in a non-local coordinate system (i.e. 1983 State Plane), you will have the following scaling options:
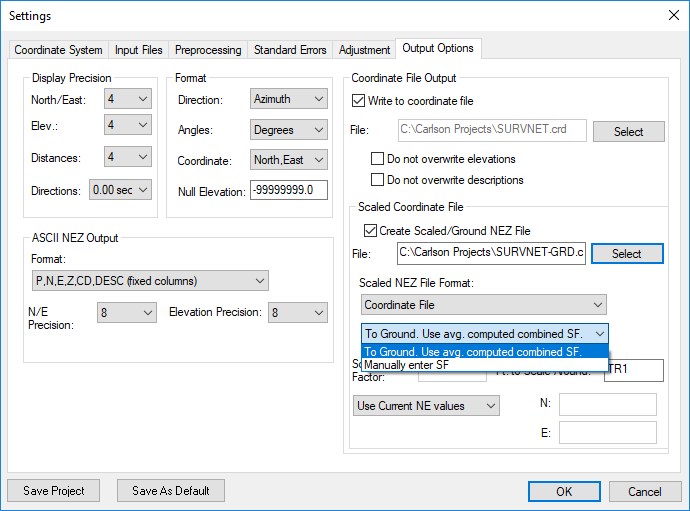
You can either enter a scale factor or use the computed grid to ground scale factor. If you select to use the computed scale factor, SurvNET will use the "average combined scale factor" as shown in the project report file.
You will also be required to enter the point number of the point you will be scaling around. This function can also be used as a translation tool. You can either "Use the Current NE values" (no translation), "Enter the new NE values" (desired N and E values for the scaling point), or "Enter Translation Values" (enter the actual delta-north and delta-east values).
If the Scaled Coordinate file exists when you process the project, you will see the following warning dialog box:
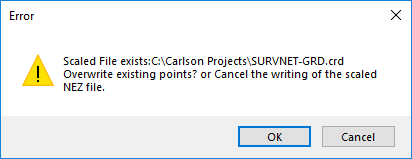
If you pick OK the points in the Scaled File will be overwritten. If you Cancel no point will be written to the Scaled File.
The menu option "Settings -- Global Settings" displays the following dialog box. If the 'Use Carlson Utilities' is chosen then the .RW5 editor will be the default raw editor and Carlson SurvCom will be the default data collection transfer program. If the 'Use C&G Utilities' is chosen then the C&G .CGR editor will be the default raw editor and C&G's data collection transfer program will be the default data collection transfer program. For additional information, refer to the Raw Data Files and Raw Data Editor Functions section of this manual.
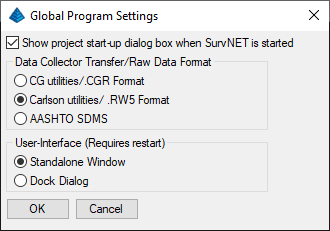
User-Interface (for CAD versions of SurvNET) - Indicate the desired graphical user interface (gui, "gooey") you wish to use.
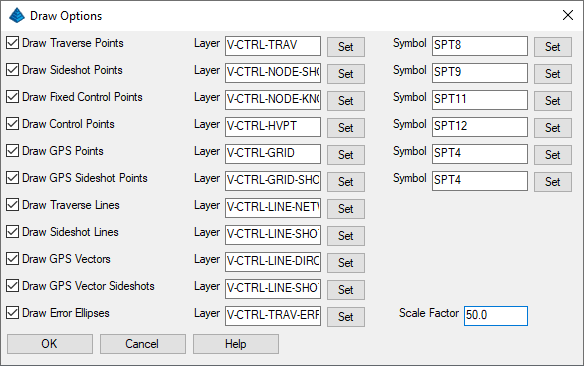
If you are running SurvNET from inside Carlson Survey, you can draw the network into the active drawing file. These are the settings for the Draw Network function.
NOTE: As a reference, the following is the suggested National CAD Standards layer list for the Drawing Settings dialong box:
Check the type points and lines you want to draw. If you want to draw the error ellipse at each point check the "Draw Error Ellipses" box. You can choose a layer for all the points and lines and a symbol for all the points.
| Converted from CHM to HTML with chm2web Standard 2.85 (unicode) |