The diagram above shows the general steps associated with the
creation of a mine plan with the Underground Timing routine.
Prerequisites include:
An example mine layout is shown below.

When the command is executed, you will be prompted to select a
part of the mine plan. The Timing Project Manager, shown below,
will then appear. Here you can define equipment, calendars,
attribute groups, and more. For more information on the Timing
Project Manager, see the corresponding section of the help
manual.


The Equip. Involved Column lists all pieces of equipment to be
used for the mine scheduling. Panels must be assigned to a specific
piece of equipment in order to be mined.

Edit Unit: This button will allow you to edit the specifications of the currently selected equipment. More information on defining equipment specifications is available in the Timing Project Manager section of the help manual.
Edit Calendar: This button will allow you to edit the current work calendar. More information on defining the work calendar is available in the Timing Project Manager section of the help manual.

The green Up/Down Arrow Icons will move the currently selected panel(s) upward or down in the list, causing it to be mined earlier or later in the sequence.
The red X icon will remove the currently selected panel(s) from the list, allowing it to be re-assigned to another piece of equipment.
Remove All: This button will remove all assignments from the currently selected unit.
Add Delay: This button will open the dialog shown below,
which controls how delays are handled. A delay will appear in the
Assignment Column as if it were another panel to be mined, and may
be moved up or down in the sequence.

The Unassigned Column lists all panels that have not yet been assigned to a piece of equipment.Delay Duration: These values control how long the delay lasts. In the above example, the equipment will be delayed for a full shift. Note that partial shift delays are allowed.
Pure Calendar Delay: This option will not force a delay. If the equipment already has scheduled downtime when the delay is encountered, additional time will not be taken off.
As Scheduled Delay: This option will force a delay even if the equipment already has scheduled downtime when the delay is encountered. The delay will wait until the scheduled downtime is complete, then the delay will be applied.
Pure Calendar Delay after precedence is satisfied: This is similar to a Pure Calendar Delay, but will not attempt to apply the delay until precedence rules have been satisfied. Consider the scenario shown in the below table. Equipment E1 is scheduled to mine Panel A and Panel C. Equipment E2 is scheduled to mine Panel B and Panel D. A precedence rule has been created that does not allow Panel D to be mined until Panel A is complete. A delay of this type is placed on Equipment E2 after Panel B. In this scenario, the finish date of Panel A will first be calculated, then the delay will be applied. If the equipment already has scheduled downtime when the delay is encountered, additional time will not be taken off.
As Scheduled Delay after precedence is satisfied: This option is similar to an As Scheduled Delay, but will not attempt to apply the delay until precedence rules have been satisfied. Consider the below scenario. Equipment E1 is scheduled to mine Panel A and Panel C. Equipment E2 is scheduled to mine Panel B and Panel D. A precedence rule has been created that does not allow Panel D to be mined until Panel A is complete. A delay of this type is placed on Equipment E2 after Panel B. In this scenario, the finish date of Panel A will first be calculated, then the delay will be applied. If the equipment already has scheduled downtime, the delay will be applied in addition to this downtime.
Due To: This dropdown menu lists the Drawing Event delays defined in the Timing Project Manager. The ellipsis button will allow you to define a new Drawing Event.


Assign: This button will assign the selected panel(s) to the selected piece of equipment.
Select: This button will select all panels according to the drop-down menu to the right of this button. If the drop-down menu is set to NONE, all panels will be unselected. If the drop-down menu is set to ALL, all panels will be selected. If the drop-down menu is set to Advance or Retreat, all panels of that type will be selected.
Sort: This drop-down list will sort the panels in the
list.
Inverse: This checkbox will invert the sorting order of the Unassigned Column.
Use Precedence: This checkbox will ensure that precedence is satisfied in the list. For example if Panel1 is assigned to precede Panel2, toggling this option on will reorder the list so that Panel1 is listed before Panel22.
Screen Pick: This button will allow you to sequence the panels by selecting them in the drawing. When activated, the Underground Timing Dialog will disappear and the drawing area will be visible. The command line will prompt you to click inside the panel to assign to the currently selected piece of equipment. Panels that have already been assigned to a piece of equipment will be filled with a transparent color. Pressing ENTER after selecting the panels will return to the Equipment Timing dialog. An example of the Screen Pick method of selection is shown below. The green filled panels have already been assigned to a piece of equipment. If pin points are in the panel, it will only hatch up to the next pin point, allowing the panel to be assigned in order as separate entities.

3D Pick: This option is not available in the Underground
Timing command - it is only available in the Surface Equipment
Timing command.
Additional scheduling options are shown below.

Starting Date: This value sets the date to begin mining operations. The ellipsis button to the right of this field will open a small calendar to assist in date selection. By default, this value will be set the Mine Start Date set in the Timing Project Manager.
Number of Shifts: This value will set the number of working shifts in a day.
Skip COAL (Key Material) for timing: This checkbox
controls if key material is used for the timing or not. When this
option is on, the key material (be it coal or some other resource)
will not be included in the scheduling. Instead, it will be assumed
that all key material will be mined quickly enough so that it never
delays the removal of waste material.
Perform Bottleneck Analysis and Bottleneck
Params: This option is intended for use in the
Surface Equipment Timing command, and is therefore not
discussed here.
Perform Period Target Analysis and Target Params: This option is intended for use in the Surface Equipment Timing command, and is therefore not discussed here.
Allow Retreat with No Advance: This option allows retreat
panels to be mined without first mining the advance panels. This
can be useful if it is more advantageous to simply refer to a panel
as retreat, even though it is only going to be mined through
once.
Collect Extended Information for Gantt Chart: When enabled
this option will allow the Gantt Chart to include extra information
such as the tonange, quality, etc.
Calculate: This button will calculate the mine schedule. In cases when the mine plan includes retreat (second) mining, the system will make sure that when the parent panel is mined on retreat, the mining (advance or retreat) in all child panels is completed. If not it tries to offset the starting date of retreat in the parent panel until the timing conflict is resolved. Sometimes it is impossible to do so and the program reports the problem to the user for manual resolution.
If any errors are encountered, the below dialog (left) will appear.
The problem report generated will appear similar to below (right).
In this example, a precedence rule has been violated for the CM1
equipment. Here, the North_Mains_1 <1:2> panel has violated a
precedence rule. This will require an edit to the assignment order
for proper timing.

If no problems are encountered, the schedule will be calculated and the below dialog will appear.
Report: This button will generate a very simple report as shown below. Note that this report does not include information about the amount of material mined. The Days Waiting in this report refer to the number of days in which a panel is waiting to be excavated due to precedence rules, or due to a scheduled delay.
Detailed Report: This button will generate a more detailed report, including information such as the amount of material mined, quality of material, downtime, etc. This report is discussed in more detail later in this help document.

The Progress Inspector allows you to step through the day-by-day schedule of each piece of equipment. The slider bar at the top of the window may be used to cycle through the dates quickly. Various information about each piece of equipment is shown in the spreadsheet view. As you progress through each day with the below controls, a symbol and label will appear on the drawing to indicate the location of the equipment. The size of the labels/symbols may be set with the Label Size and Symbol Size. A different symbol may be selected by clicking the Select button.
Run: This button steps through the overall mine progression day-by-day. You may modify the playback speed by changing the Replay speed option.
Stop: This button stops the action of the Run button.
Rwnd: This button returns the inspector to the first working day of the schedule.
Prev: This button steps to the previous day in the mine schedule.
Next: This button steps to the next day in the mine schedule.
Report: This button is only available after calculating
the mine schedule. This button will open the Detailed Report
dialog. This is the same dialog that will appear after selecting
the Detailed Report option after clicking the Calculate
button.

Date Range: This option will set this range of dates to report.
Report by: This drop list will determine how the timing map is generated.
If the Dates option is selected, the timing map will be colored by date ranges.
If the Amounts option is selected, the timing map will be colored by amount intervals.
If the Equipment option is selected, the timing map will be colored by equipment.Dates Table: This button will open the Dates Table, shown below, which is used to define the various time periods used for reporting.

The above dialog can be used to create custom time periods to show in the timing map. The green and red icons at the top of the dialog will add and delete rows of information.
End Date: This column sets the ending date of the period.
Range: This column is automatically generated, and simply identifies the Date Range for the period. Dates may be preceded by > or < to mark indefinite time periods.
Color: This column sets the color of the time period. Double clicking one of these cells will open the CAD color palette.
Pattern: This column sets the hatch pattern for the timing blocks.
Scale: This column sets the scale of the hatch pattern.
Layer: This column sets the CAD layer on which to draw the timing block.
Label: This column sets a custom label for the timing block.
Clear: This button will clear the table of all information.
Auto Set: This button will open the below dialog, which allows for quick population of the Custom Dates table.
Starting Line: This value will set the row to begin the automatic population of the Custom Date table.
Starting Date: This is the Date From that will be used on the Starting Line. The ellipsis button will open a small calendar to assist in date selection.
Hatch Scale: This value will set the hatch scale for the new time periods.
Hatch Pattern: This field will set the hatch pattern for the new time periods. The ellipsis button will open the list of available hatch patterns.
Set Layer: This option will overwrite the Layer names when enabled.
Layer by: This drop list determines how the layers will be populated. If the Single Layer option is selected, all layers will be the same, according to the Layer text box. If the Year option is selected, the layer will be set by the year of the time period.
Set Colors: This option will set custom colors for the new time periods. There are two options for setting colors - by using a Color Palette, or by using a Color Increment.
Color Palette: This option will use a predefined color palette to color the time periods. When the end of the palette is reached, the colors will start over. Palettes may be added, edited or remove used the corresponding buttons. An example color palette is shown below. Colors may be added or removed from the palette by clicking the Plus or X icons, and colors may be modified by double-clicking them. Any of the predefined palettes may not have their name modified. If you modify the colors in a predefined palette, you may click the Reset button to return to the default colors.
Amounts Table: This button will open the Amounts Table, shown below, which is used to define the various amount intervals used for reporting.
The above dialog is very similar to the Custom Dates table previously discussed. The primary difference is that the dates are replaced with the Amounts column. These values may represent one of the following values to be mined, set according to the Amount Type:
- Total Tons
- Key Material Tons
- Waste Tons
- Total Area
- Mined Area
- Total Volume
- Key Material Volume
- Waste Volume
- User Grid
Auto Set: This button will open the below dialog, which is very similar to the Auto Set dialog used in the Custom Dates table, as previously discussed. This dialog differs in that amounts are specified rather than dates, and the periods are set to repeat for a set number of times, rather than being based on the dates.

Equipment Table: This button will open the Equipment Table, shown below, which is used to set the colors for each piece of equipment to be reported. This is like a simplified version of the Dates Table and Amounts Table. Here there is no option to set a report period - only the color, hatch, layer, and label for each piece of equipment.
Report Only: This option will not create a timing map; only the mine schedule will be reported. When selected, many other options on the dialog will be ghosted out. This runs much faster than creating a timing map.
Subdivide by Property Lines: This option will sub-divide the report by property owner.
Stop at last period: This option is only available when the Custom Amount Table report option is selected. This option will end the schedule at the last entered user row in the Custom Amount Table.
Draw Legend: This option will draw a color legend of the timing map. The Legend Size can be used to make the legend larger or smaller.Black/White Pit Outline: This option will draw the boundaries of the timing periods with a white/black color as opposed to matching the color of the hatch.
Text Block Label: This drop list will determine how the labels are drawn in the timing map.
The No Block Labels option will not draw labels.
The Draw Actual Dates option will label the starting and ending date of each period.
The Draw Period Names option will draw labels defined in the Custom Date Table.
The Use Custom Names option will draw labels defined in the Custom Amount Table.
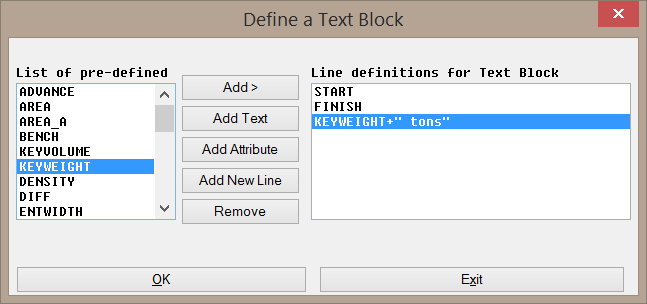
The Use Custom Text Block option will draw labels according to the below dialog. When selected, the Text Block Style, Add, Edit, and Remove buttons will become available. The Text Block Style dropdown list will list all available text block labels. The Add button will create a new text block. The Edit button will edit the currently selected text block. The Remove button will remove the currently selected text block.
The left side of the above dialog contains pre-defined keys that may be used in the labels. The right side of the dialog shows how the text block label will appear.
Add: This button will add the selected attribute to the current line. Multiple attributes may be added to a single line.
Add Text: This button will add custom text to the current line. In the above example, "tons" has been added as a suffix to the KEYWEIGHT attribute.
Add Attribute: This button will add any attribute that is not defined in the pre-defined list. This attribute name must match an attribute available in the final text report.
Add New Line: This button will create a new line in the text block. In the above example, three lines have been created.
Remove: This button will remove the selected line from the text block.
Text Size: This value will set the text size of the block labels.
Text Autosize: This option will automatically size the text of the block labels.
Text Style: This option will set the text style to use for the period labels. The Select button will allow you to select one of the existing text styles.
Length-wise labels: This option will rotate the block labels in line with the mining direction of each bench. If not selected, labels will be drawn perpendicular to the mining direction.
Draw Hatch: This option will create boundaries for the timing periods and fill them in with the specified hatch pattern/color.
Retreat Hatch: This option sets the hatch pattern for the retreat hatches. The ellipsis button to the right of this option will open a list of available hatch patterns.
Buffer Hatch/Width: This option will not hatch in the full period, but will instead create a thick boundary of a specified width. The width determines the offset from the perimeter. An example of a Buffer Hatch is shown below.
 Hatch Transparency: When using the SOLID hatch, this setting controls the transparency of the hatch. The range is from 10%-90%. This allows for viewing the entities behind the hatch. An example of transparent hatches is shown below. Note that if transparency is not used, you would not be able to see the pillars and projection lines behind the hatches.
Divide advance/retreat display: This option will divide the hatches for advance and retreat hatches down the length of the panel. Advance hatches will be drawn on the right of centerline and retreat hatches will be drawn on the left.
Hatch pillars precisely: Hatches just the entries on the advance, leaving the pillars open. Then if there is retreat mining, the pillars are hatched separately as they are retreat mined.
Output Spatial Database: This option will output the report information to an SQLITE database. The database will retain the coordinate system of the drawing for linkage with GIS software packages. You may specify the file by clicking the ellipsis button to the right of the checkbox.
Skip Report Formatter: This option will skip the report formatter. Rather than customizing the format of the report, the information will be automatically sent to a text file preview.
Examples of a timing map and a generated text report are shown below. Note that there are MANY ways that a timing map and report may be formatted. The Report Formatter is used to generate the text report, but this dialog is not discussed at length here.
There are many attributes available in this report. Most of these attributes are self explanatory, but some are not as clear. The below definitions are therefore provided.
- Difficulty Factor: This mining rate factor represents the difficulty of mining a specific area. A value of 1.0 means that mining progresses at a normal rate. This value is the product of the Equipment Difficulty and the Location Difficulty.
- Equipment Difficulty: This value is the product of the optional difficulty rates set in the equipment definitions. This can include
- Date Difficulty
- Thickness Difficulty
- Bench Difficulty
- Location Difficulty: This value is a difficulty factor determined by a hierarchy of the following three options. If the high priority item is detected, it will be used instead of the other two options. If the high priority option is not detected, the medium priority item will be used. If neither of these items are detected, the low priority item will be used. The low priority item defaults to a value of 1.0, so if no location difficulty is defined, the mining rate will not be affected.
- Highest priority: text in the drawing on the DIFFICULTY layer
- Medium priority: DIFFICULTY attribute value/grid in the Timing Project Manager Attribute Groups
- Lowest priority: Difficulty value assigned to the specific panel
- Calendar Days: Actual period length rounded up (to account for partial days)
- Operating days: Actual period length rounded up, minus days that do not have at least one working shift
- Days: Scheduled Hours divided by Shift Length
- Weekdays Worked: Weekdays with at least a portion of shift worked
- Saturdays Worked: Saturdays with a least a portion of a shift worked
- Sundays Worked: Sundays with a least a portion of a shift worked
- Days Waiting: Number of days equipment cannot work due to a precedence rule
- Work Shifts: Number of shifts when production took place
- Hours Scheduled: Number of hours equipment is scheduled to work (this includes Hours Utilized, Hours Delayed, and Hours Available)
- Hours Down: Number of hours equipment is not scheduled to work (due to downtime scheduled on the calendar)
- Hours Utilized: Number of hours equipment is actually working
- Hours Delayed: Number of hours equipment is delayed due to a Drawing Event or Scheduled Delay (note, this is not the same as Hours Down)
- Hours Available: Number of hours is scheduled to work, but is neither being utilized nor is it actually delayed. If a piece of equipment encounters a delay during the middle of the shift, the partial shift time remaining will be counted as Hours Available (the delay will be applied to the next shift)
The below image helps visualize the organization of the different definitions of Hours.
Undo Report: This button will delete a previous timing map and clear the calculated schedule. This allows for quick what-if analysis of the scheduling.
Events Report: This button will display the Events
Report, which lists all Drawing Events encountered during the mine
schedule. Drawing Events are discussed in more detail in the
Timing
Project Manager. This report is only available after a Detailed
Report has been generated. An example of the Events Report is shown
below.


Utilization Report: This button will generate a Utilization Report of the mine schedule. This report lists each shift for each piece of equipment. Scheduled delays will be reported as such. An example of the Utilization Report is shown below.


Prompts
Select any part of mine plan: Pick any centerline in
the mine plan
Underground Timing Dialog
Pull-Down Menu Location: Underground
Keyboard Command: schedule_mine
| Converted from CHM to HTML with chm2web Standard 2.85 (unicode) |