Draw Profile is a flexible routine for drawing a profile anywhere in the drawing. The profile can be placed in a layout tab or in the model space of the drawing. It may be drawn with or without a grid or with just tick marks. The vertical curve annotations for a road profile and manhole annotations for a sewer profile, may also be drawn. Draw Profile uses the profile information that is stored in .PRO files. It is also able to use a reference centerline stored in a .CL file. Once the profile is drawn using Draw Profile, the design and labeling routines of the Profiles dropdown are applicable to the profile. Please note, several of the options presented in the following dialogs will depend on the type of unit system being used, metric or english. Options such as text sizes, sheet dimensions, and scaling factors may vary from the examples shown here.
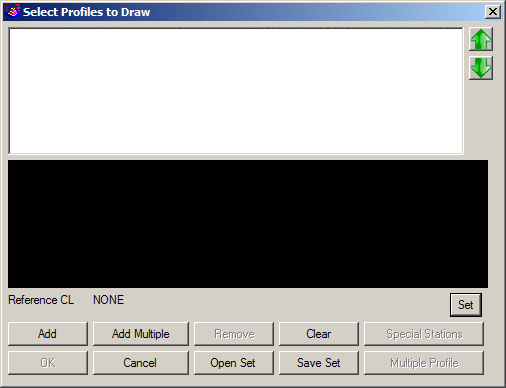
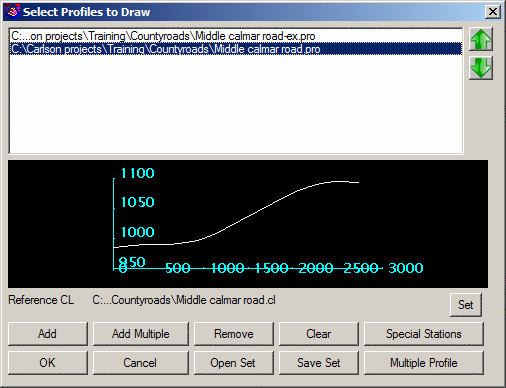
Reference CL: When using Draw Profile to create Plan & Profile Sheets, a reference centerline will be needed to properly establish the "Plan" portion of the sheet. Use the Set button to locate and specify the desired Reference Centerline.
Add: Use this option to add desired Profile (*.PRO) files one at a time into the dialog box.
Add Multiple: Use this option to add desired Profile (*.PRO) files (one or several at a time via standard Windows Shift+click and/or Ctrl+click functionality) into the dialog box.
Remove: Use this option to remove the currently selected profile the dialog box.
Clear: Use this option to remove all profiles from the dialog box.
Special Stations: Use this option to to label stations that are significant for the project.
Open Set: Opens/loads a previously saved set of Profile files as stored in a *.PST file.
Save Set: Permits the current collection of profiles to be saved to a *.PST file for later recall.
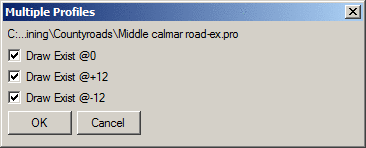
Multiple Profile: For *.PRO files that have multiple profiles within the same file (e.g. those produced by Input-Edit Profile that might have profile data at the centerline and also at offsets of -12 and +12), use this button to select which of the profiles to draw:
Another type of multiple profile is a profile with breaks such as a curb profile with breaks across intersections. This is built-in to Road Network (aka RoadNet). In RoadNet Settings (specifically, the Output Options tab), there's Output EOP Profiles. RoadNet will then create profiles with descriptions at the intersections and Draw Profile will break the profile across the intersections. You can also manually put in these descriptions in Input-Edit Profile to set the breaks. Use EP_FL:@E to stop the profile and EP_FL:@S to resume the profile.
When the Select Profiles To Draw dialog has been set up, select the OK button to move on to the Draw Profile dialog box.
Within the Draw Profile dialog box are numerous sub-commands that permit great flexibility in how the resulting profile(s) are drawn. Use the table below to access additional information about each of these sub-commands:
For each of the sub-commands above that have a check-box toggle, enable the toggle and use the appropriate Setup button to further access the option.
Link To Files: This setting controls the linkage of the plotted profile(s) to the actual profile file(s) (.PRO), determining how changes to the file affect the plotted profile(s):
Match Line Elevations: For high relief profiles that might otherwise exceed the profile limits of the sheet (typically dependent on the Vertical Scale), the Match Line Elevations option can be used to "break" (or vertically split) the profile and redraw the remaining portion (again, shifted vertically) to remain in the profile portion of the sheet.
Elevation Range: This is the range of elevations that is used in conjunction with the Match Line Elevations option. If the range is exceeded (that is, if the range is greater than 80), the program will break the profile and draw the remainder with a separate vertical axis range.
Output to Separate Drawing: When enabled, this option draws the profile(s) to a separate drawing. Use the Set button to specify the name/location of the external drawing. Suggested uses for this feature are when profile-only sheets need to be generated and provided to others for detailing or construction purposes.
Horizontal Scale: Indicate a real-world distance that should be used within the span of a horizontal grid cell.
Vertical Scale: Indicate a real-world elevation amount that should be used within the span of a vertical grid cell.
The Layers button permits layer names to be associated with items including the profiles, profile grid and general labels.
The Colors button provides the ability to control the color
associated for items such as the profiles, profile grid and general
labels. Any color selected will override the default
ByLayer.
The Text/Symbol button has the text style and size scalers for profile grid and general labels. The size scalers are multiplied by the profile Horizontal Scale to determine the text size in drawing units.
Double-Click Text Link Profile Settings: When enabled, double-clicking a drawn profile text item launches the Draw Profile Settings for that text item. When disabled, double-clicking the text item launches the native CAD command (e.g. Edit Text).
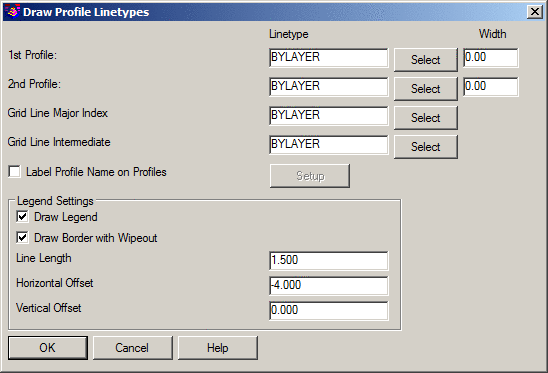
The Linetypes button has linetype settings for the profile line and profile grid. There are also settings for drawing a profile legend of the profile lines.
Back: Allows you to return to the previous dialog box to alter or adjust the information it provides.
Load Settings: Loads a saved collection of Draw Profile settings, saved in a (.PFS) file.
Save Settings: Saves all Draw Profile settings in a (.PFS) file. Use this to be able to use all the settings on a future project.
The Draw Grid option controls whether or not the grid and axis elevations for the profile are drawn. The Setup button launches the Grid Setup dialog. Here you can control numerous settings for how the grid, general text and stationing are drawn.
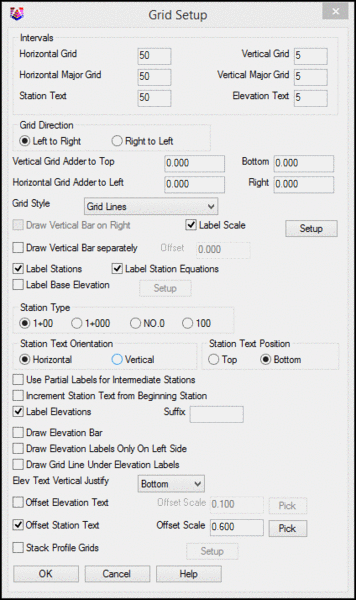
Horizontal Grid: Enter a value of how often grid lines should be displayed to coincide with the station values along the horizontal axis of the grid.
Horizontal Major Grid: Enter a value of how often major (or "heavy") grid lines should be displayed to coincide with the station values along the horizontal axis of the grid.
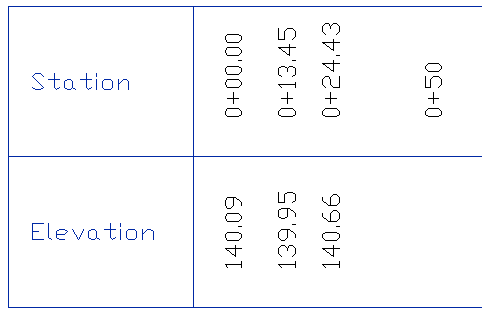
Station Text: Indicate how often station text labels should appear along the horizontal axis of the grid.
Vertical Grid: Enter a value of how often grid lines should be displayed to coincide with the elevation values along the vertical axis of the grid.
Vertical Major Grid: Enter a value of how often major (or "heavy") grid lines should be displayed to coincide with the elevation values along the vertical axis of the grid.
Elevation Text: Indicate how often elevation text labels should appear along the vertical axis of the grid.
Grid Direction: Profiles can be drawn Left to Right (the default) or Right to Left. Although most profiles are drawn left to right, if you have a road that runs East to West and you wish to draw the profile stationing beneath the actual road stationing, then choosing a Right to Left profile may be appropriate.
Vertical Grid Adder to Top: This adds the specified amount of grid to the top of the profile.
Bottom: This adds the specified amount of grid to the bottom of the profile.
Horizontal Grid Adder to Left: This adds the specified amount of grid to the left of the profile.
Right: This adds the specified amount of grid to the right of the profile.
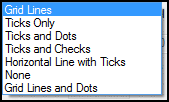
Grid Style: This selects the type of Grid to generate. The choices are
Grid Lines, Ticks Only, Ticks and Dots, Ticks and Checks,
Horizontal Lines with Ticks, None and Grid Lines and Dots
Draw Vertical Bar on Right: This option places the vertical label bar on the right of the grid, as opposed to the left.
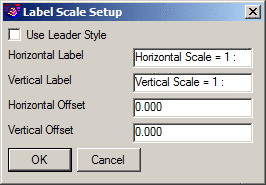
Label Scale: Click on this option and you obtain a scale drawn at the lower left corner of the profile. Click the Setup button to establish the desired Scale labels and placement values.
Label Stations: Disable this option if you do not want station labels to be placed along the grid.
Label Station Equations: Disable this option if you do not want station equation labels to be placed along the grid.
Label Base Elevation: Labels the low elevation on the sheet. The setup dialog allows for prefix and suffix for the text, size of text, layer and number of decimals to display.
Station Type: Indicated the preferred style of station formatting.
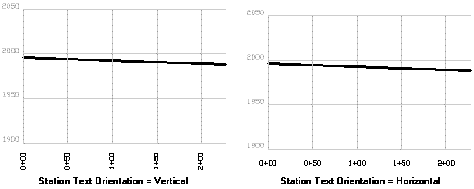
Station Text Orientation: This option allows you to specify the orientation of the station text shown along the profile. The example below shows both options:
Station Text Position: Indicate if the station text should appear along the top of the profile grid or along the bottom of the profile grid.
Use Partial Labels for Intermediate Stations: Enable this toggle if the "full station" content to the left of the "+" symbol should be omitted at intermediate stations. This is useful for large station values where intermediate station labels are desired. When enabled (assuming 100' station values), an intermediate station such as 1023+50 would simply be annotated as +50.
Increment Station Text from Beginning Station: Enable this option if you wish to have the station text labels be relative to the starting station value. For example, if the starting station value is 0+23.68 and the Station Text interval is 50, station labels of 0+73.68, 1+23.68, 1+73.68, etc, would be generated.
Label Elevations: Disable this option if you do not want elevation labels to be placed along the grid.
Draw Elevation Bar: Click on this option if you desire to have a vertical barscale displayed. It will run up and along the left-most vertical grid line of the profile, unless the Draw Vertical Bar on Right option is selected.
Draw Elevation Labels Only On Left Side: Enabling this option eliminates elevation labels on the right side of the profile.
Draw Grid Line Under Elevation Labels: Enabling this option extends the grid lines underneath the elevation labels.
Elev Text Vertical Justify: Indicate vertical justification for the elevation labels.
Offset Elevation Text: This option offsets the left-side vertical axis text using the specified Offset Scale.
Offset Station Text: This option offsets the horizontal axis Station text by the specified Offset Scale, allowing the insertion of elevation or other information above the stationing. It is often used in conjunction with the Label Horizontal Axis options.
Stack Profile Grids: This option allows you to stack profile grids for multiple profiles. In the Setup dialog, all profiles in the Multiple Profile file are listed and you can choose which one goes to the first grid, which one is second, and so on.
Grid Vertical Spacer: Indicate the amount of vertical space between successive grids.
Plan Only, Profile Only, or Plan and Profile sheets can be created. The options within Sheet Setup become available when this toggle is checked on. Select Setup to access the Sheet Setup dialog.
Choose Space: Indicate whether sheets are to be drawn to Paper Space (also known as a Layout) or to Model Space. When the Model Space option is selected a toggle for how the sheets are created is enabled. They can be displayed in Paper Space or Model Space. If the Paper Space toggle is used the sheet will be drawn in Model Space but with Paper Space units.
Layout Name: Enter a name for the paper space "tabs" to be assigned to each layout for each sheet. The program will automatically divide the plan view and the profile view into sheet layouts, and if the length of the profile extends beyond a single sheet, then multiple layouts are created, with the layout name ID incremented by 1.
If you enter "ms" to go to model space within a Layout tab, you can pan to alter the plan view position. However, it is best to zoom in/out and edit within the Model tab. The Layout tabs appear at the bottom of the screen, along with the "Model space" tab to go back to standard plan view:
Add Layout Name to File for Drawing Output: When the option to Output To Separate Drawing is on, this option will create a separate DWG file for each layout by adding the layout name to the main DWG file name.
Use Template Layout: This option allows you to use a layout that exists in the current drawing as the template for layouts created by the command. This option only works for paper space sheet creation.
Start/End Station in Layout Name: These options allow you to include starting and ending station in the Layout Names.
Add Layouts to Layout Set: This option allows you to add the layouts created to an existing layout set that was previously generated using the Layout Set Manager. You will need to specify the name of the layout set.
Block Name: This is the drawing name for the plan and profile sheet to be inserted. The Set button can be used to change the block name. Carlson provides a standard plan and profile border in the form of profile.dwg located in the working folder of %AppData%\Carlson Software\...\Sup\. You may wish to revise profile.dwg and add your company logo, and re-save it as profile1.dwg. Alternatively, you could add your own complete version of a Plan and Profile sheet block/border. Be aware that the Draw Right to Left option in Draw Grid is superseded when Draw Sheet is enabled. Note that the Sheet mode will re-orient the centerline left to right, which may cause text (such as the stationing) to plot upside down, until you use the Flip Text command.
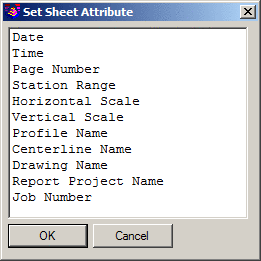
Set Sheet Attributes: This button allows you to specify the values used by any attribute definitions associated with the sheet Block Name. These can be entered manually in the Set Sheet Attributes dialog.
You can use the Set button to the right of any field to set that field to a preset value pulled from the drawing information.
Sheet Width: This is the profile width in the units specified on the sheet.
Lower Left Offset X/Y: Indicate the offset value(s) for the insertion point of the sheet in CAD units. This option allows user-defined Block Names to be properly positioned relative to the remainder of entities placed through the Draw Profile command.
Printer/Plotter: Indicate the desired output device.
Paper Size: Indicate the desired paper size.
Draw Profile Grid Lines: Enable this option if your Block Name does not contain profile grid lines and if you want profile grid lines to appear on the sheet.
Draw Plan/Grid to Full Sheet Width: Enable this option if you want to have what would otherwise be "partial" sheets (typically found at the end of a Plan & Profile Sheet run) occupy the full width of the sheet.
Draw Grid to Full Sheet Height: Enable this option if you want to have the profile grid drawn to the height of the sheet.
Stack Profile Sheets: When enabled (and when the Choose Space option is set to Model), this option permits the profiles to be stacked on top of one another.
Stack Vertical Spacer: Specify the amount of space that should be utilized when Stack Profile Sheets is enabled.
Sheet Contains: This drop list allows the selection of which type of sheet to generate.
Plan View Lower Y: This sets the lower position of the paper space window for the plan view.
Top Y: This sets the upper limit for the plan view window.
Profile View Lower Y: This sets the lower position of the paper space window for the profile view.
Upper Y: This sets the upper limit for the profile view window.
Plan/Profile Gap: Indicate the amount of vertical separation between the Plan portion of the sheet and the Profile portion of the sheet.
Draw North Arrow in Plan View: This draws a North Arrow in plan view. Click the North Arrow Settings button to establish the desired North arrow and placement information.
Draw Plan View Borders in Model Space: This draws the borders in Model Space which can be useful or orienting text and other labels to the orientation of the sheet. When this option is selected, use the Layer text box or Set button to choose the layer on which the borders will be drawn.
Plot at 1:1: With this clicked on, the sheet will be paper size, designed to be plotted at 1:1. A 30-inch profile sheet will measure 30 units, even though the centerline and profile may be 1500 feet in length. If the Scale 1:1 option is turned on, then you cannot check the distances of features using commands such as Bearing and Distance on the Inquiry menu, because the distances will be scaled down by a factor equal to the drawing scale (for example, at 1"=50', the reduction in scale factor is 1/50 or 0.02). You can set the absolute starting coordinate for the 1:1 scaled plot by setting the Sheet Lower X and Sheet Lower Y values. With this clicked off, the profile will drawn full size, with a 1500-foot profile measuring 1500 feet.
Fit Each Vertical: With this option turned on, the program will size the profile grid to fit within the vertical space on the profile sheet. With this option off, the profile grid is sized to fit the elevation range of the profile.
Tile Sheets: If clicked on, only one Layout is created in paper space, and all sheets appear in this single Layout as tiles of individual sheets, much like the tiles mode of viewing files within Windows Explorer.
Starting Page Number: Specify the desired page number for the sheet(s) about to be cut. This is commonly used with the Set Sheet Attributes option.
Label Match Line: When clicked on and multiple sheets are plotted with plan view option on, a match line will plot in the plan view.
Overlap Stations: In multiple plan and profile sheet plotting, after the first sheet, all subsequent sheets will have the first 2 stations in common with the last 2 stations on the previous sheet, if the Overlap Station option is turned on. For example, if the last 2 stations are 3+10 and 3+20 on sheet 1, then sheet 2 will start with 3+10, then 3+20, with this option turned on. With this option turned off, if the first sheet ends with 3+20, then the second sheet would begin with 3+20.

This option creates elevation labels along the horizontal axis. Pick Setup to access the Horizontal Axis Elevations settings dialog. A preview of the labels will be shown to the right of the settings. If the preview does not match the settings, click the Update Preview button.
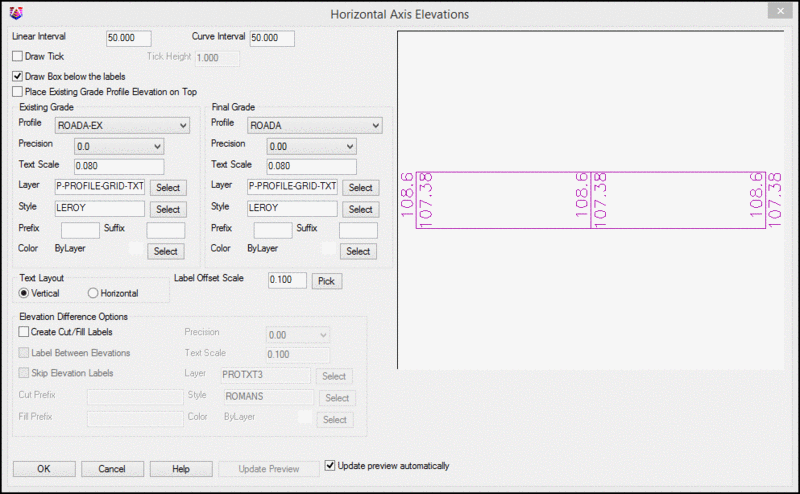
Linear and Curve Interval: Indicate how often the profile elevation labels should be placed along the horizontal axis of the sheet. The Curve Interval applies within vertical curves and the linear applies everywhere else.
Draw Tick and Tick Height: This option draws a line at the specified height at each station for the elevation labels.
Draw Box Below the Labels:
When enabled, a box is drawn around the
labels.
Place Existing Grade Profile Elevation
on Top: When enabled, places the existing grades above the
profile grid as opposed to below.
Existing/Final Grade: Indicate the appropriate profile, precision, text scale, layer, style, prefix, suffix and color for the text labels.
Text Layout: Indicate whether the text labels should be oriented vertically or horizontally.
Label Offset Scale: Indicate the distance from the horizontal axis for the labels. If the value is negative, the labels are placed above the horizontal axis.
Elevation Difference Options: If both existing grade and final grade are to be drawn, you may choose to also label the Cut/Fill depth values with the appropriate precision, text scale, layer, style, prefix, suffix and color for the text labels that separates the existing and final profiles at each station.
Label Between Elevations: When enabled (and for a Text Layout of Vertical), the label is centered on the various elevations and Cut/Fill Difference label.
Skip Elevation Labels: When enabled, only the Cut/Fill Difference label is generated.
This option draws a boxed area either above or below the profile. It is best used in standard Draw Grid mode, with Draw Sheets clicked off. Pick Setup to access the Horizontal Label Box Setup dialog which has a list of available fields to label. To label a field, highlight the field from the Available list and pick the Add button. Then use the Up/Down buttons to order the fields in the used list.
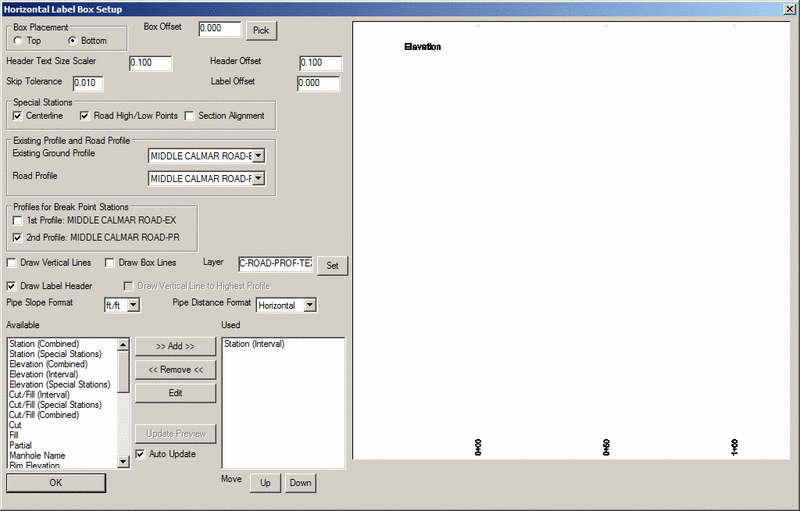
Box Placement: Set this to either Top or Bottom.
Box Offset: This controls how far to offset the box from the profile.
Header Text Size Scaler: Indicate a relative scale size for the header text values. This value is a scaler that is multiplied by the profile horizontal scale.
Header/Label Offset: This controls how far to offset the Header Text/Label Text box from the profile.
Skip Tolerance: Indicate a threshold in which labels should not be placed in an effort to reduce annotation clutter.
Special Stations: This controls whether special stations on the Centerline, high and low points on the profile and odd stations that exist in a Section Alignment are labelled.
Existing and Road Profile: Set which profile is existing and which is the finished road.
Profiles for Break Point Stations: Toggle on which profiles should be used for break point stations.
Draw Vertical Lines: This option draws lines from the data point on the profile to the label in the box.
Draw Box Lines: This option draws the row and column lines for the label box.
Layer: Set the layer for the elements to be drawn on.
Draw Label Header: Indicate whether or not the label header(s) should be drawn.
Draw Vertical Line to Highest Profile: This option is only available when the Draw Vertical Lines toggle is on. When on the vertical lines will be drawn to the highest profile.
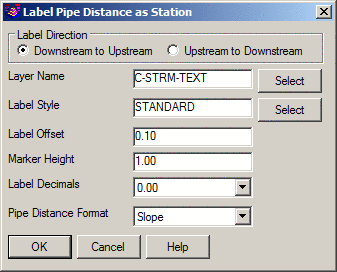
Pipe Slope Format: Use this drop down to set the slope format between unit per unit or expressed as a percent.
Pipe Distance Format: Use this drop down to set whether the pipe length is shown as the horizontal distance or the slope distance.
Add and Remove: Use the >>Add>> button to add items to the list for annotation. Use the <<Remove<< to remove items from the list.
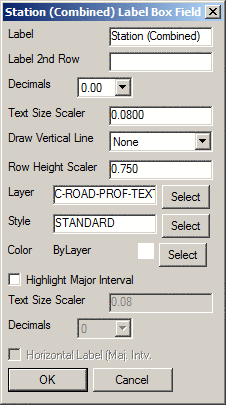
Edit: Use the Edit button to set parameters for the label in the box. The Label 2nd Row option creates another row for the field.
Use the Update Preview to see the results of your changes before committing them to a sheet. An example of the resulting plot is shown here:
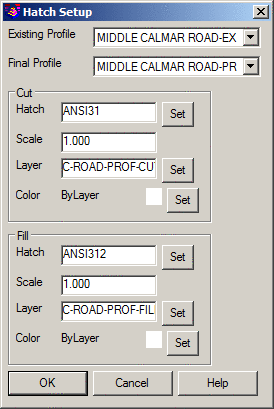
Use the Hatch Cut/Fill toggle to enable Hatch Setup. Choose the hatch pattern you would like to use for Cut and Fill as well as the scale, layer and color for each.
When enabled, this option allows you to detail additional slope information onto selected profiles.
Indicate the desired profile(s) whose slope annotation you'd like to control and click on the Setup button for expanded criteria.
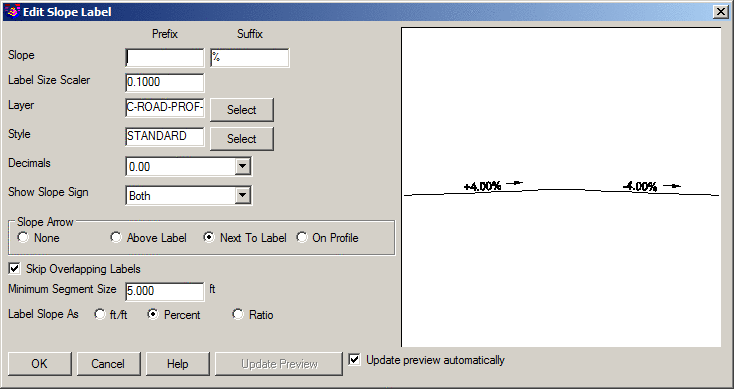
Prefix/Suffix: Enter a prefix or suffix on the slopes as desired. Be aware that you may want to add spaces after the prefix or before the suffix.
Label Size Scaler: Set the label size scaler appropriate to your sheet setup.
Layer and Style: Set the layer and style for the text.
Decimals: Set the number of decimal places for the annotation.
Show Slope Sign: Indicate the preferred method for distinguishing positive vs. negative slopes.
Slope Arrow: If you would like a slope arrow to help understand the direction of slope, use one of the radio buttons for Above, Next to or On the profile.
Skip Overlapping Labels: If the labels would overlap and you do not want that to happen, use the Skip Overlapping Labels toggle.
Minimum Segment Size: You may not want to annotate shorter segments. If not, set a minimum segment size.
Label Slope As: You have the option of labeling the slope express as unit per unit, as a percent or as a ratio.
Update Preview: Use the update Preview button to see what your changes would look like before committing them to sheets.
When enabled, this option will label station values along the profile line above each break point in the profile. Pick Setup to access the Break Point Station Setup dialog.
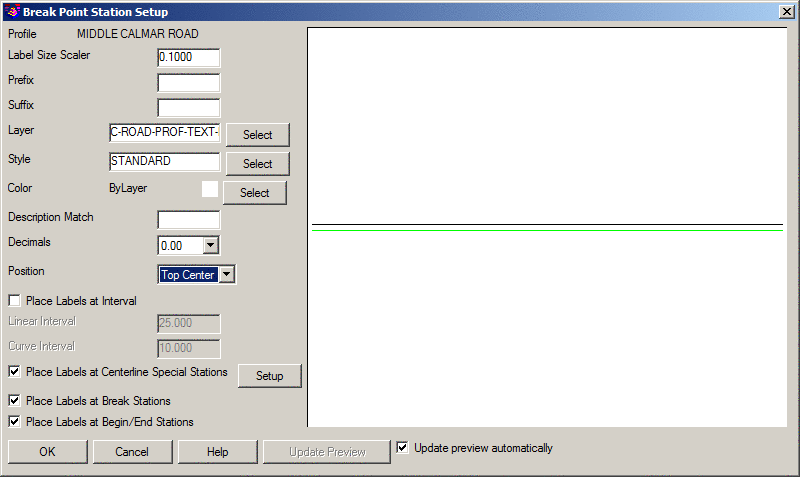
Label Size Scaler: Set the label size scaler appropriate to your sheet setup.
Prefix/Suffix: Enter a prefix or suffix on the slopes as desired. Be aware that you may want to add spaces after the prefix or before the suffix.
Layer, Style and Color: Set the layer, style and color for the text.
Description Match: Set the description you are looking to match.
Decimals: Set the number of decimal places for the annotation.
Position: Set the position for the text top or bottom and left, center or right.
Place Labels at Interval: Set up linear and curve intervals for the text.
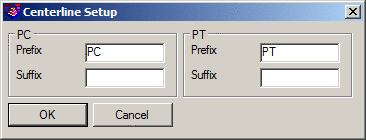
Place Labels at Centerline Special Stations: Turn the toggle on and select the Setup button to change the settings.
Place Labels at Break Stations: Toggle this on to place labels at break stations.
Place Labels at Begin/End Stations: Toggle this on to place labels at the beginning and ending stations.
Update Preview: Use the update preview button to check your changes before committing them to a drawing.
When enabled, this option will label elevation values along the profile line at each break point in the profile. Pick Setup to access the Break Point Elevation Setup dialog.
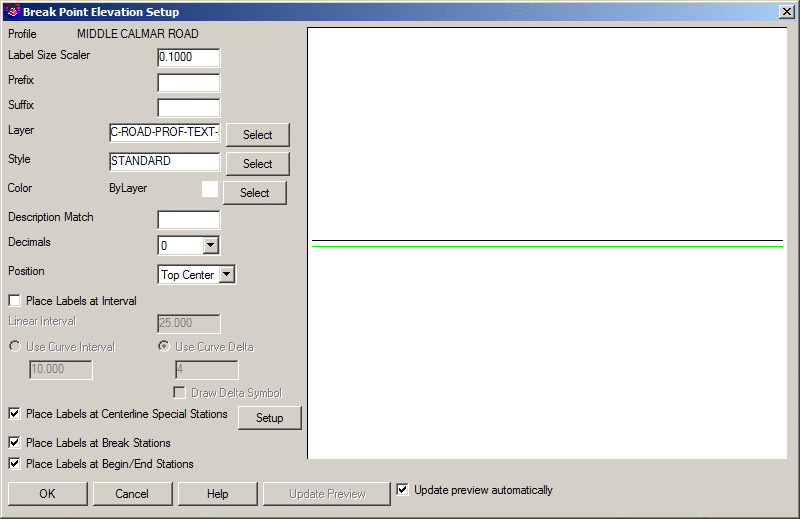
Label Size Scaler: Set the label size scaler appropriate to your sheet setup.
Prefix/Suffix: Enter a prefix or suffix on the slopes as desired. Be aware that you may want to add spaces after the prefix or before the suffix.
Layer, Style and Color: Set the layer, style and color for the text.
Description Match: Set the description you are looking to match.
Decimals: Set the number of decimal places for the annotation.
Position: Set the position for the text top or bottom and left, center or right.
Place Labels at Interval: Set up linear and curve intervals for the text.
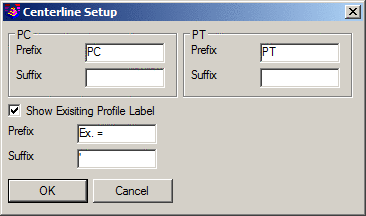
Place Labels at Centerline Special Stations: Turn the toggle on and select the Setup button to change the settings.
Place Labels at Break Stations: Toggle this on to place labels at break stations.
Place Labels at Begin/End Stations: Toggle this on to place labels at the beginning and ending stations.
Update Preview: Use the update preview button to check your changes before committing them to a drawing.
When enabled, this option will label descriptions along the profile line at each break point in the profile. Pick Setup to access the Break Point Description Setup dialog.
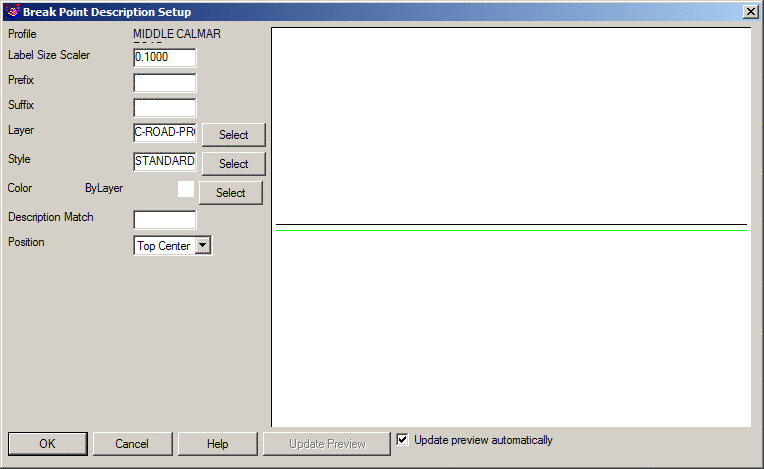
Label Size Scaler: Set the label size scaler appropriate to your sheet setup.
Prefix/Suffix: Enter a prefix or suffix on the slopes as desired. Be aware that you may want to add spaces after the prefix or before the suffix.
Layer, Style and Color: Set the layer, style and color for the text.
Description Match: Set the description you are looking to match.
Position: Set the position for the text top or bottom and left, center or right.
Update Preview: Use the update preview button to check your changes before committing them to a drawing.
When enabled, this option will label elevation difference values along the profile line at each break point in the profile relative to a reference profile (e.g. existing grade). Pick Setup to access the Break Point Elevation Difference Setup dialog.
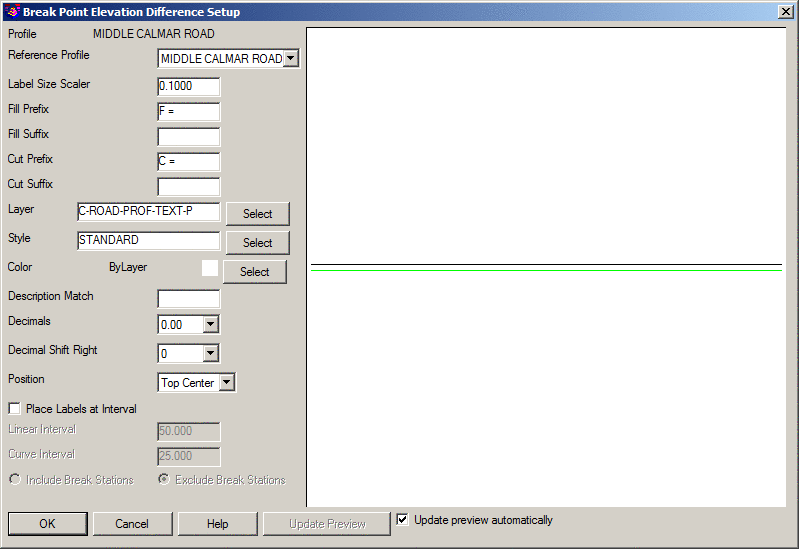
Reference Profile: Indicate the profile that should be used as the point of comparison for the break point locations.
Label Size Scaler: Set the label size scaler appropriate to your sheet setup.
Prefix/Suffix: Enter a prefix or suffix on the slopes as desired. Be aware that you may want to add spaces after the prefix or before the suffix.
Layer, Style and Color: Set the layer, style and color for the text.
Description Match: Set the description you are looking to match.
Decimals: Set the number of decimal places for the annotation.
Decimal Shift Right: Indicate the number of places to shift the decimal point to the right. For example, if a traditional elevation difference was calculated to be 1.234 and the Decimal Right Shift value is set to 1 (a factor of 10), the reported elevation difference would be shown as 12.34.
Position: Set the position for the text top or bottom and left, center or right.
Place Labels at Interval: Set up linear and curve intervals for the text.
Include/Exclude Break Stations: Use the radio buttons to toggle between including or excluding break stations.
Update Preview: Use the update preview button to check your changes before committing them to a drawing.
Click this button to establish if it desirable to have a leader and/or break point symbol used in conjunction with the Draw Break Point Sta and/or Draw Break Point Elev options.
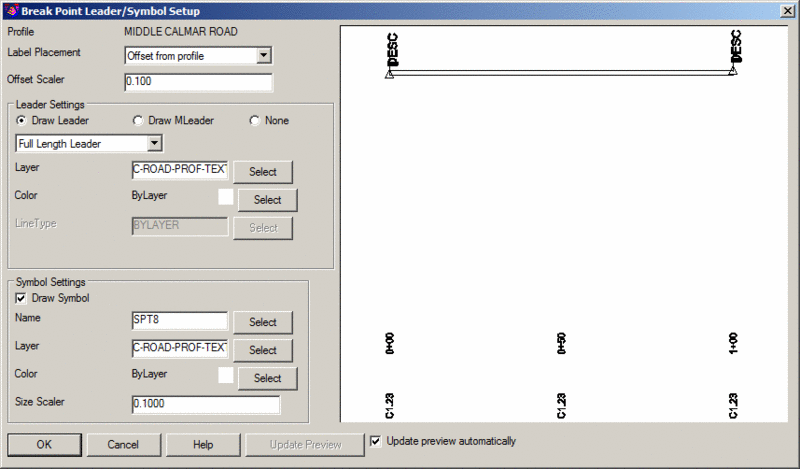
Label Placement: Use the label placement settings to control where this annotation will be placed.
Offset Scaler: Set the label size scaler appropriate to your sheet setup.
Leader Settings: Set one of the two options for how the leader is drawn.
Symbol Settings: Set and select the symbol, layer, color and scaler for the symbol.
Update Preview: Use the update preview button to check your changes before committing them to a drawing.
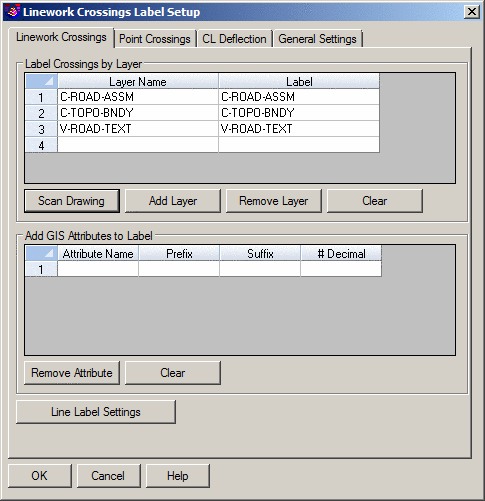
This option draws labels for linework that crosses the reference centerline. The reference centerline is set in the first Draw Profile dialog where the profiles to draw are selected. The Setup dialog has a list of layers. The program will find intersections between the reference centerline and linework on these specified layers. For each layer, there is a Description which is used for the label on the profile. Besides labeling these descriptions for the crossings, the program includes the station along the reference centerline at the crossing. In the options dialog, there are settings to control the layer, style, color, size, decimal places for the station label, label position and whether to draw a vertical line from the label to the profile.
When enabled, this option will label the location(s) of any road(s) from an identified Road Network that intersect the main road.
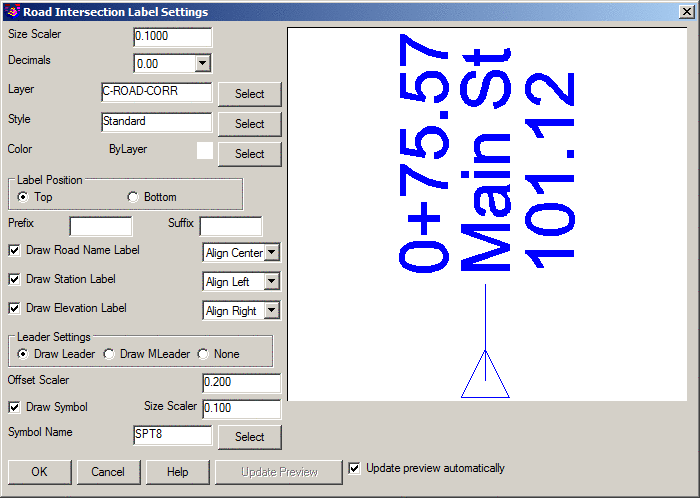
Size Scaler: Set the label size scaler appropriate to your sheet setup.
Decimals: Set the number of decimal places for the annotation.
Layer, Style and Color: Set the layer, style and color for the text.
Label Position: Use the label placement settings to control where this annotation will be placed.
Draw Road Name Label, Draw Station Label, Draw Elevation Label: Toggle on to draw the this annotation and set the location.
Leader Settings: Indicate the type of leader to be drawn.
Offset Scaler: Indicate the plotted distance between the symbol and the text label(s) to establish the length of the leader.
Draw Symbol: Toggle this on to set a symbol and the size of the symbol.
Update Preview: Use the update preview button to check your changes before committing them to a drawing.
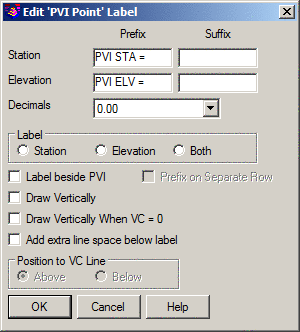
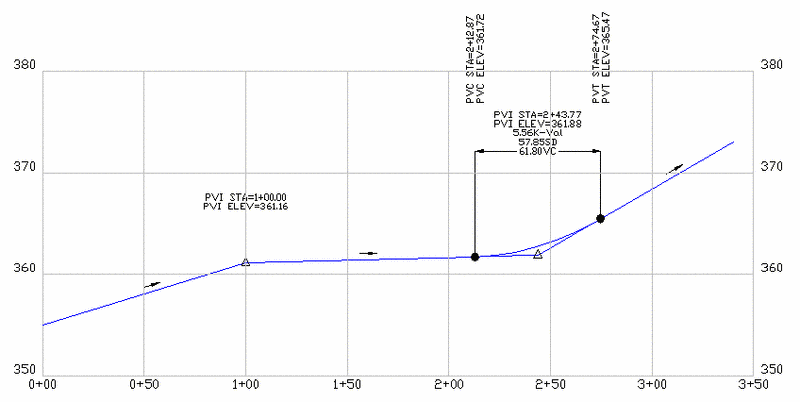
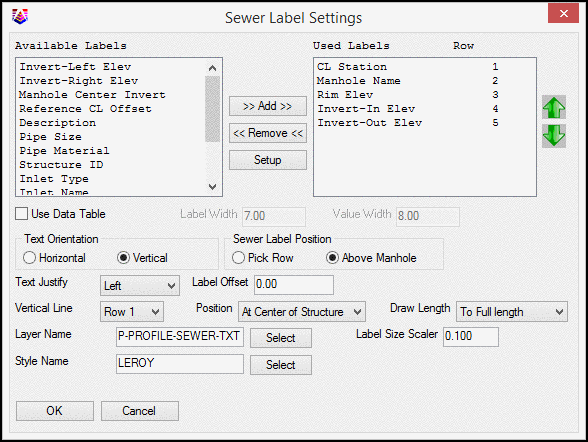
This button opens Vertical/Circular Curve Settings dialog. From a wide variety of available labels, you are able to create your own label selections very conveniently. Each label can be edited individually through the Setup button. You can specify the prefix, suffix, symbol style, decimal places, text orientation and position, etc, in the Edit Label dialog.
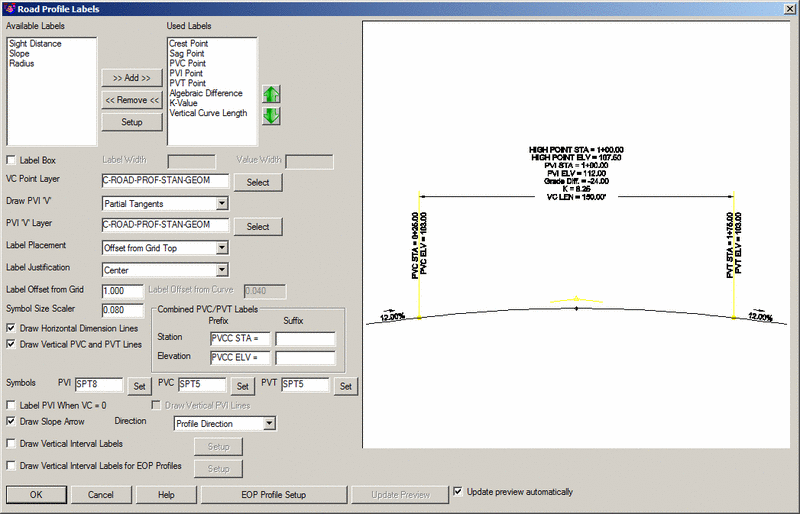
Draw PVI 'V': You can choose to draw either a full tangents style PVI
'V' point, or a partial tangents style, or
nothing.
PVI "V" Layer specifies the layer
that the tangent lines will be drawn on
Label Placement: This setting determines where to place the vertical curve labels. There are six options: Pick Single Row, Pick Individual Position, Auto Place Above Highest PVI Point, Specify Offset from Grid Top, Offset from Curve - Aligned, Offset from Curve - Horizontal.
Label Justification sets the text
justification to Left or Center
Label Offset from Grid/Curve: Indicate
the distance from the Grid or Curve when the Label Placement option is set to Offset from
Grid Top or Offset from Curve,
respectively.
Symbol Size Scaler sets the size for
the symbols at the vertical curve points
Draw Horizontal Dimension Lines: This option draws horizontal lines connecting the PVC and PVT of all vertical curves.
Draw Vertical PVC & PVT Lines:
This option draws vertical lines emanating
from the PVC and PVT of all vertical curves.
Combined PVC/PVT Labels sets the
prefix and suffix for the stations and elevations of the vertical
curve components
Symbols for the PVI, PVC and PVT can
all be selected from the symbol library.
Label PVI When VC=0: When vertical curve length is 0, no label is created unless you choose this option and then the PVI label would be shown.
Draw Slope Direction Arrow: Draws an arrow to indicate slope direction.
Arrow Direction: You can choose from Profile Direction, Uphill Slope Direction and Downhill Slope Direction.
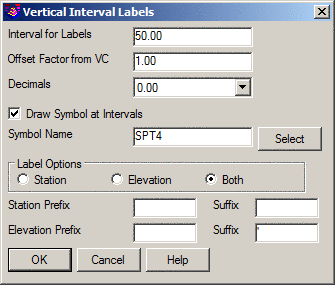
Draw Vertical Interval Labels: This option labels the intervals of the vertical curve section. In its setup dialog, you can specify the intervals, distance from the vertical curve to put the labels, decimal places to display the interval stations and elevations, symbol settings and label settings.
Here is an example of a road profile.
This button allows you to establish the criteria for drawing and labeling Edge of Pavement (EOP) profiles:
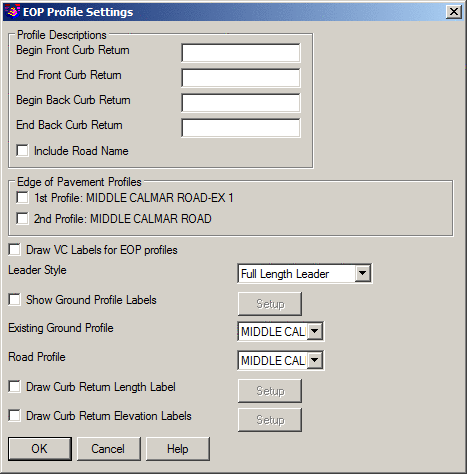
Begin/End Front Curb Return: Enter a description for the front curb return.
Begin/End Back Curb Return: Enter a description for the back curb return.
Include Road Name: Enable this control if you'd like the road name included with the edge of pavement profile.
Draw VC Labels for EOP Profiles: When enabled, this option will label vertical curves found in edge of pavement profiles.
Draw Curb Return Length Label: When enabled, this option will label the length of curb returns. Use the Setup button to specify and control the display settings.
Draw Curb Return Elevation Labels: When enabled, this option will label the elevations of curb returns. Use the Setup button to specify and control the placement and display settings.
This button opens Draw Sewer/Pipe Options dialog.
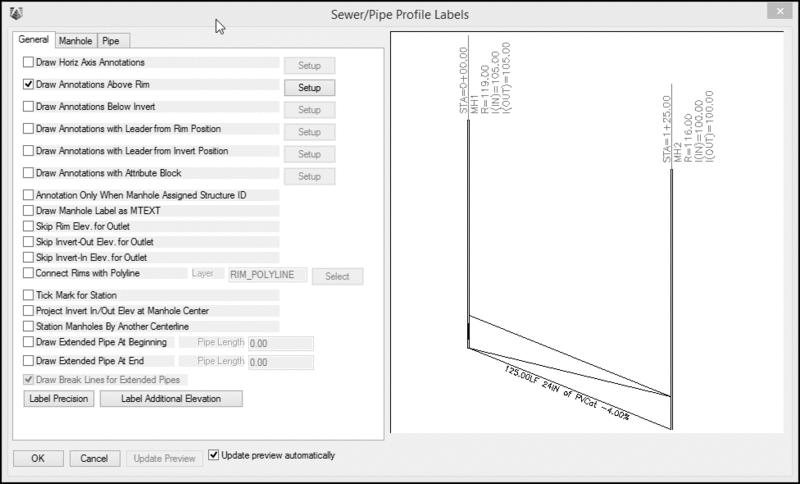
Each style has a Setup dialog to
specify which labels are to be created and in what order. For
labels with leaders, you can setup the leader styles
Example of Settings for Draw Annotations above Rim
In addition to the numerous annotation options found on the General Tab, many of the options will also contain an Equation option that permits user-defined equations using numbers and/or Rim, Invert Out or Step Up for even additional control. For example, to label rims with 2 elevations for 2 datums, one might specify an equation of [RIM] + 1.0 (or similar).
Draw Horiz Axis Annotations: Labels structure or pipe profile along the horizontal axis.
Draw Annotations Above Rim: Creates structure or pipe profile labels above the rim of manholes.
Draw Annotations Below Invert: Creates structure or pipe profile labels below the rim of manholes.
Draw Annotations with Leader from Rim Position: Creates structure or pipe profile labels with a leader from manhole's rim position.
Draw Annotations with Leader from Invert Position: Creates structure or pipe profile labels with a leader from manhole's invert position.
Draw Annotations with Attribute Block: Inserts blocks with attributes for the structure or pipe labels.
Draw Manhole Label as MTEXT: When enabled, the manhold label will be placed as an MTEXT entity.
Skip Rim Elevation/Invert Out Elevation/Invert In Elevation for Outlet: When enabled, the cited component(s) will not be placed for the special Outlet structures.
Connect Rims with Polyline: When enabled, a polyline representing the average grade between each pair of rim elevations will be drawn to the specified layer.
Tick Mark for Station: Draws a tick mark at every station.
Project Invert In/Out Elev at Manhole Center: The Invert In/Out elevations are not the actual values, but are projected elevations to the manhole center.
Station Manholes by Another Centerline: This option will make new station for each manhole by referencing the profile to another centerline, for example a road centerline.
Draw Sump: When enabled, specify the height of the sump to be drawn into the sewer profile.
Draw Base: When enabled, specify the base height to be drawn into the sewer profile.
Draw Extended Pipe At Beginning/End: Draws the pipe beyond the beginning or the end by a specified length.
Draw Break Lines for Extended Pipes: When enabled (and requires either Draw Extended Pipe At Beginning or Draw Extended Pipe At End to be enabled), a "squiggle" is drawn at the end of the extended pipe to indicate that it is a partial pipe. Otherwise, the pipe end is left "open".
Label Precision: Click on the Label Precision button to set the amount of precision used for sewer station, elevation, length and slope labels.
Label Additional Elevation: This option may be utilized to apply a scale factor (e.g. Imperial Units to SI Metric Units) for plans that require alternate units to be cited.
On this tab, you are able to specify how to label the manhole name and how to draw the manholes.
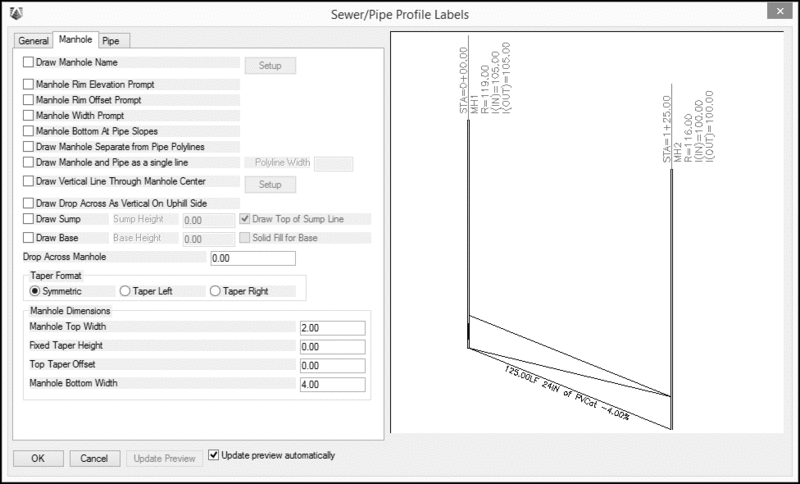
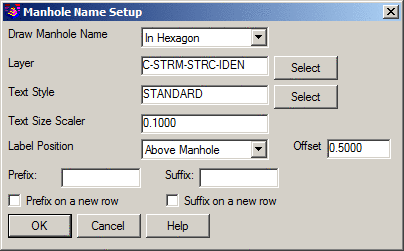
Draw Manhole Name: Enable this option and select the desired geometric shape that shall circumscribe the manhole name. If selected, enter any desired prefix or suffix for the labels.
Draw Manhole Sides Down To Invert: Closes the manhole at pipes.
Manhole Rim Elevation Prompt: Ignores the manhole's rim elevation and prompts to enter new values.
Manhole Rim Offset Prompt: Prompts to enter the offset value and adds the offset to the manhole's rim elevation.
Manhole Width Prompt: Enable this option to prompt for the top width of the manhole.
Manhole Bottom at Pipe Slopes: Enable this option to prompt for the bottom width of the manhole.
Draw Manhole Separate from Pipe Polylines: Enable this option to draw the shape of the manhole as a separate polyline from that of the pipe.
Draw Vertical Line Through Manhole
Center: Draws a vertical line through
the manhole center from rim to bottom of profile
grid.
Draw Sump: When enabled, specify the height of the sump to be drawn into the sewer profile.
Draw Base: When enabled, specify the base height to be drawn into the sewer profile.
Drop Across Manhole: Adds a step up to the invert-in elevation.
Taper Format, Manhole Dimensions: When drawing from a profile file created with the Design Sewer/Pipe Profile command, these parameters are used to define the manhole shape and dimension. When drawing from a profile created from Network in the Hydrology module with commands such as Export to Profiles, these Draw Profile settings are ignored and the dimensions come from the Network instead. The taper settings are used for transitioning between different manhole top and bottom widths. The Top Taper Offset sets the distance from the top of the manhole to the point that the taper will end. The Fixed Taper Height determines the overall length of the tapered section.
In this example image, all the manholes have Top Width of 2 and Bottom Width of 4. Manhole #1 has Top Taper Offset of 2 and Fixed Taper Height of 0. Manhole #2 has Top Taper Offset of 100 and Fixed Taper Height of 0. This large Top Taper Offset is greater than the manhole depth so that the taper runs the full length of the manhole. Manhole #3 has Top Taper Offset of 3 and Fixed Taper Height of 1.
Here you can choose to label pipe in a very flexible order. Each label has a setup function which specifies the label prefix and suffix, decimal places, row number and etc.
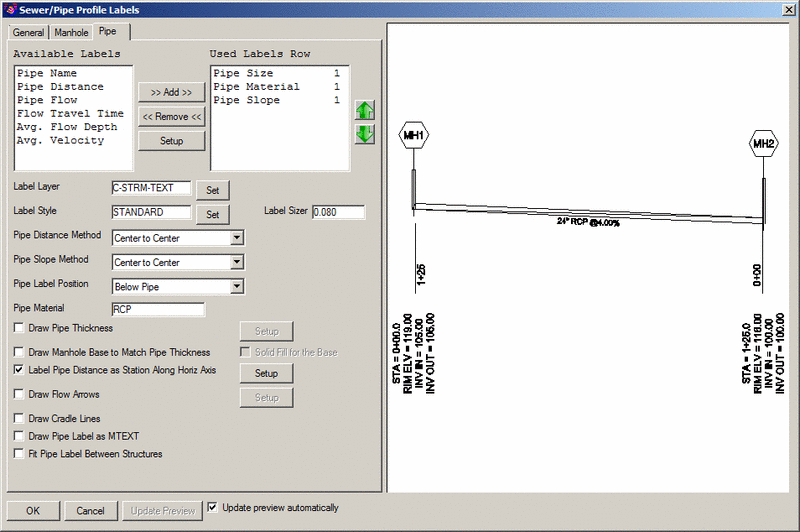
Label Layer: Set the layer for the labels.
Label Style: Set the text style and size of the text.
Pipe Distance Method: Label either the center to center distance or the actual distance of the pipe.
Pipe Slope Method: Choose from three common methods of calculating pipe slope.
Pipe Label Position: Choose from along the pipe, along the axis or inside the pipe.
Pipe Material: Indicate the type of material used for the pipe.
Draw Pipe Thickness: When selected, draws pipes in profile as double lines indicating the thickness of the pipe. This option also allows for cross hatching of the double lines.
Draw Manhole Base to Match Pipe Thickness: When selected, this option draws the base of the manhole to the same depth relative to the pipe thickness.
Label Pipe Distance as Station Along Horiz Axis: This option creates pipe distance labels as the station style along the horizontal axis. Click the Setup button to access the labeling method and style.
Draw Flow Arrows: Indicate if arrows should be drawn illustrating the direction of flow.
Draw Cradle Lines: If the sewer profile contains cradle data, this option would draw cradle lines above and below the pipe segments.
Draw Pipe Label as MTEXT: When enabled, text labels will be drawn as a multiline text (MTEXT) entity.
Fit Pipe Label Between Structures: When enabled, this option will ensure that pipe labels will fall within a structure-to-structure distance.
This button opens Pipe Crossing and Link Label Options dialog, which contains all the settings for drawing a pipe crossing type or profile, or the pipe crossings when pipes or sewer networks in the drawing are intercepted by a profile to be drawn.
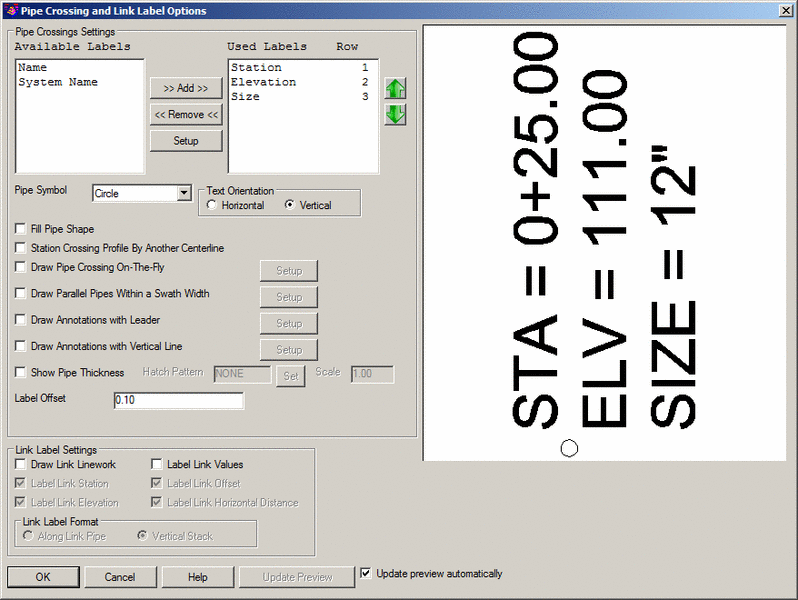
(Setup) Label Prefix/Suffix: Indicate labels that should precede and/or follow the pipe information.
(Setup) Label Precision: Decimal places of the labels.
(Setup) Label Station/Elevation/Size/Name/System Name: Options to label the parameters or not.
Pipe Symbol: Options to show pipe crossing in circle, square, or based on the pipe shape.
Text Rotation: Labels can be drawn either horizontally or vertically. This option becomes disabled when the Draw Annotations with Leader option is enabled.
Fill Pipe Shape: When enabled, the cross-section area of crossing pipes will be hatched for visual distinction.
Station Crossing Profile By Another Centerline: This option will make new stations by referencing the profile to another centerline, for example a road centerline.
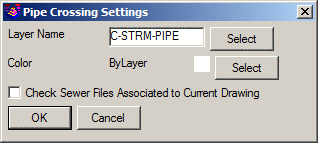
Draw Pipe Crossing On-The-Fly: When this option is chosen and there are pipes or sewer networks drawn in the drawing, the program will prompt to select a reference centerline that represents one of the profiles to be drawn to detect the pipe crossings. Any pipe crossings found would be drawn with other profiles.
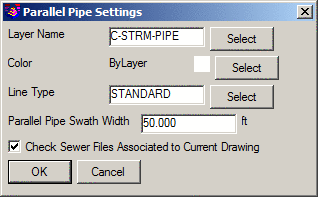
Draw Parallel Pipes Within a Swath Width: When this option is chosen and there are pipes or sewer networks drawn in the drawing, the program will prompt to select a reference centerline that represents one of the profiles to be drawn to detect if there's any pipe segments that are within a swath width along the profile. Any pipe segments found would be drawn with other profiles.
Draw Annotations with Leader: When enabled, this uses a leader in conjunction with pipe labels.
Draw Annotations with Vertical Line: When enabled, this uses a vertical line and orientation to indicate the location of the pipe crossing being labeled.
Show Pipe Thickness: When enabled, this draws the pipes in profile using double lines to indicate the thickness of the pipe. The area between the lines can be cross-hatched.
Link Label Settings: Settings to determine how to draw link labels.
An Example of Pipe Crossings On-The-Fly
An Example of Parallel Pipes Within a Swath Width
These settings apply for profiles create from a Sewer Network from the Hydrology module that contains lateral structures. There are several lateral data fields available for labeling. Use the Add/Remove buttons to make the list of fields to label. Use the Setup button to set the prefix and suffix for each field, and control whether the field is labeled on a separate row. There are settings to choose the symbol on the pipe at the lateral station, the text orientation, whether to draw a vertical line at the lateral station, set the label position and offset, set the text justification and whether to draw a leader from the pipe to the label.
Lateral Symbol: Set this to circle, square or pipe shape as appropriate.
Text Orientation: Use this to control whether the text is oriented horizontally or vertically.
Draw Vertical Line: Set the vertical line to none or a number of rows.
Label Position: Use this to set the label position relative to the Right-of-Way, Connection or Mainline.
Label Offset: Set the offset of the label relative to its reference point.
Text Justify: Use this to justify the text either center, left or right.
Draw Annotation with Leader: If you want to use a leader, enable this option.
Show Lateral Thickness: Use this setting to show the thickness of a lateral.
Update Preview: Use this button to update the preview window and review your changes before committing them to a drawing.
Station Profile By Another Centerline: This option will derive stations by referencing the utility to another centerline, for example a road centerline.
Draw Connection: When enabled, and for Utility Networks that have been assigned Connections, the connection point(s) is (are) drawn into the profile.
Label Connection: When enabled, and for Utility Networks that have been assigned Connections, the label(s) for the connection point(s) is (are) drawn into the profile.
Draw Annotations with Leader: This option will permit the Utility label to be placed with a leader with further control via the Setup option.
Label Offset: Indicate the plotted distance the Utility label should be drawn away from the Utility entity.
Grid Starting Station: Indicate the desired starting station for the profile grid.
Ending Station: Indicate the desired ending station for the profile grid.
Grid Top Elevation: Indicate the bounding upper elevation for the profile.
Grid Bottom Elevation: Indicate the bounding lower elevation for the profile.
Polyline should be drawn in direction of
increasing stations.
CL File/<Select pipe crossings on-the-fly
or parallel pipes centerline>: Pick
a polyline upon which to base the stationing or Type C to select an existing Centerline .CL file and then
press Enter
Centerline Starting Station <0.0>: Press Enter to accept the default station value specified or Type in the beginning station then press Enter
Pulldown Menu Location(s):
Civil > Profiles, Survey > Surface,
Hydrology > Network, Construction/Takeoff > Roads, Field >
Roads
Keyboard Command: drawprof
Prerequisite: A profile .PRO file