


The Carlson Report Formatter routine is a highly customizable and flexible reporting engine that can be used to create a variety of output document types. A number of Carlson routines provide an option to use Report Formatter Options and allows you to specify how and which results of calculations should be presented in the report. In addition to the Standard Report Viewer, reports can be generated in web-friendly HTML format along with data formats compatible with Microsoft® Excel or Microsoft® Access.

Format: Select an available report format from the list of pre-established report configurations or key-in a new report format name.
Save: Saves the current configuration of the active report format. To save a new version of the format, type in a new name (or use the current name to overwrite old one) and click on the Save button. The next time that you come to the Report Formatter from the same Carlson routine, it will recall this last format. To pick another format, select from list of formats in the left top corner and pick which format to use.
Delete: Removes the current report configuration from the listing of available report formats.
Export: Sends ALL available report formats to an XML-based "formatter style" (*.FMS) file.
Import: Imports the contents of a previously exported *.FMS file.
| Control | Action |
|---|---|
|
|
Moves the selected report option in the Used listing above the preceding entry until it reaches the top of the list. |
|
|
Moves the currently selected item from the Available listing to the Used listing. |
|
|
Removes the currently selected item from the Used listing and makes it selectable once again to the Available listing. |
|
|
Moves the selected report option in the Used listing below the following entry until it reaches the bottom of the list. |
Sort Field: For the selected "field" of data, indicate its sort method:
Columnar Format: When enabled, this toggle groups a given field of data into a column in the report. When disabled, each field of data is placed onto its own row in the report (the report data is output in a single column).
Mirror the Columns: (Suggested for short reports only). When enabled, this toggle transposes columns from the report into rows and vice versa.
Display Table Header: When enabled and exporting the report to an HTML Report format, the field "keys" as defined in the "Attribute Options" control are included in the report header.
Use Commas in Numbers: When enabled, this option will insert commas into numeric fields for every three digits.
Auto-width: When enabled, the width of each column is automatically set to be the wider of the column heading or the data contained within the column.
Widths by Field: When enabled, the width of each column established in the Attrib Options control (found in the Settings Tab) is used per field.
Fixed-width: When enabled, specify the width of each column.
Ignore Repeating Fields: When enabled, only the first occurrence of a repeating field is display in the report. Subsequent occurrences of the repeated field (e.g. the point description) are suppressed until a different value in the repeating field is encountered.
Totals Only: When enabled, only the total of each field is reported.
Total: Select the desired total for the Used field(s) of data.
Once the desired fields of data and reporting options have been specified, the output can be generated and manipulated using one of four tabs:
Choose one of the output options:
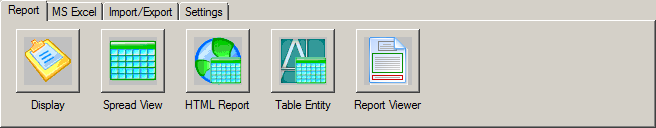
| Control | Action |
|---|---|

|
Sends the current report to the Standard Report Viewer command. Upon exiting the Viewer, you come back into the Report Formatter for further data manipulation as needed. |

|
Sends the current report to a "spreadsheet" interface where it can be further exported to a variety of popular file formats. Additional information is provided in the Spreadsheet discussion. |

|
Sends the current report to an Internet/web-ready HTML file format and displays the report using the HTML viewer that is configured on your computer. |

|
Places the current report as a table-type of entity into the current drawing. Additional information is provided in the Table Entity discussion. |

|
Places the current report into a special-formatted report. Additional information is provided in the Report Viewer discussion. |
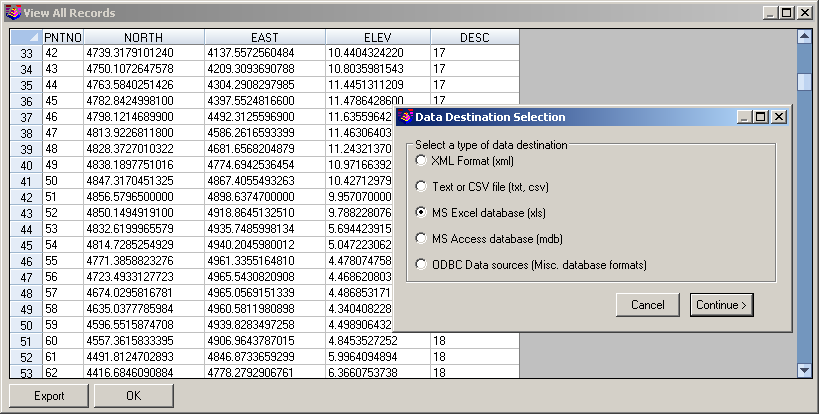
Export: This button has the same output options as the Export function under the Import/Export Tab. Use this option to create a variety of popular file formats, including:
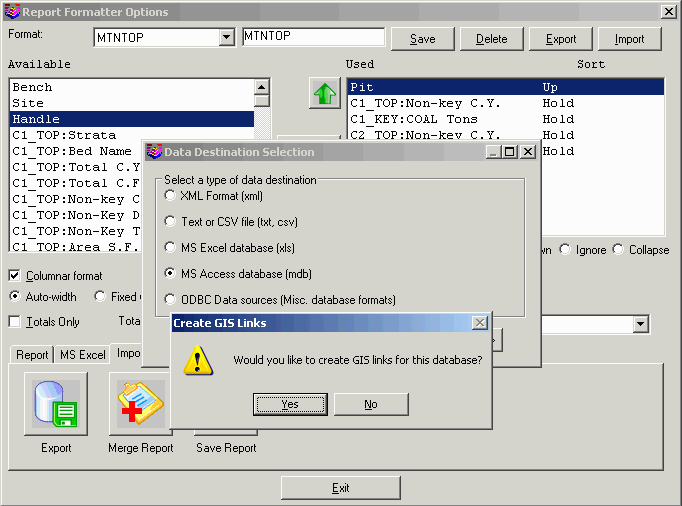
For commands that process reports using perimeter polylines, the Report Formatter has an option to create GIS links between the polylines and the database records when the Export to MS Access function is used. Some commands that can utilize this functionality are Surface Mine Reserves with the pit polylines and Underground Timing with the panel polylines.
When the polyline data is available for the GIS Links, there will be a report field called Handle. This Handle field is the entity name for the polyline and serves as the hook for the GIS link. The Handle field does not need to be put into the report Used list in order to create the links. When the Export function is called with the MS Access method, there is a pop-up window prompt for whether to create the GIS links. When these links are created, you can then use the GIS Data commands from the GIS module to manage and report the data.
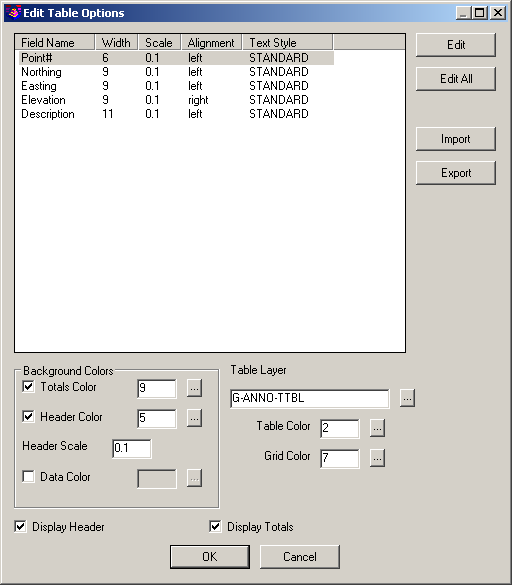
The data for the Table Entity is put into a queue and the table is not drawn until the Report Formatter is closed. Then the program prompts for a location to draw the table and provides options shown above to control items such as the header names, sizes, alignments, styles, colors and layers. You can also set whether to draw the table header and totals.
The Report Viewer option provides the ability to produce more professional looking reports that contain horizontal and vertical dividing lines and can also be exported to a variety of common report formats.

Indicate the paper size you will be printing to along with desired values for:
Upon specifying the desired values and clicking OK, the Report Viewer dialog box will display:

Controls within the report viewer allow you to:
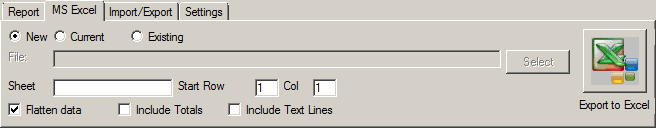
Several Microsoft® Excel export options are provided. You may specify a spreadsheet file to load before the export, as well as a left upper cell to start with and sheet name to use. Totals and text lines which are reported when using built-in viewer may be skipped when using Microsoft® Excel export.
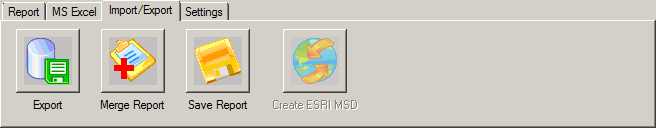
| Control | Action |
|---|---|

|
This button contains the same export options as described in the Spreadsheet discussion. |

|
This button allows the current report to be combined with a previous report. |

|
This button saves all the report data values as well as all the report format settings into a single *.RPT file that can be shared with others, merged with other reports or loaded at a later time. |

|
For commands and data that conform to the ESRI Mapping Specification for DWG/DXF (MSD), this button creates an ESRI® MSD-compatible report. |
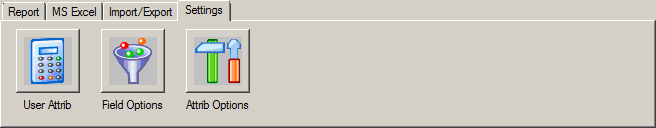
| Control | Action |
|---|---|

|
This option allows you to define new fields as equations based on existing fields. Additional information is provided in the User-defined Attributes discussion. |

|
This option allows you to further customize additional content (e.g. Date/Time, Report Name, etc) into the report header, body and/or report footer. Additional information is provided in the Field Options discussion. |

|
This option allows you to control several parameters of each field including title names, number of decimal places, etc. Additional information is provided in the Attribute Options discussion. |
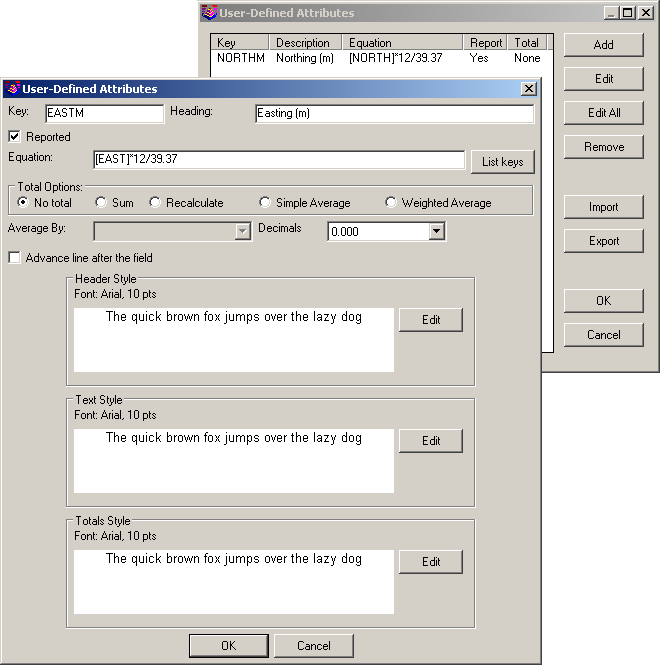
You can create highly customizable fields of data using parametric equations from other fields of program-generated data... all without the use of an external spreadsheet! User attributes may also have one of the several summation options just like program-generated ones. This feature makes the Report Formatter a very flexible tool for results exploration and reporting.
The summation level is defined by the "Total" pop-up list in the middle of the dialog. By default, only grand total will be displayed at the bottom of the list. By picking the next item in that box, you will get subtotals added each time the value in first column is changed. It makes most sense to use this kind to summation if the corresponding column is sorted.
For example if the first column is "Area Name" and it is sorted, and "Total" is set to "Grand, Area Name" the report will have a sub-total for each distinct Area Name.

"Field Options" can be placed into one or more locations within the report:
Select the desired location for the field and then click on the various controls to add or remove the item from the desired location or change its formatting information.

In addition to controlling the user-friendly heading text, you can also indicate totaling methods including:
When controlling the number of decimal places, the values can also be rounded up to the nearest integer level such as when earthwork volumes need to be reported to the nearest 1000. There is an option to Advance Line After the Field of the report which inserts a blank row and shifts the next attributes down to a new line in the report. To specify a particular field width, highlight/select the field and choose Edit to set the desired field width.
Pulldown Menu Location(s):
-various-
Keyboard Command: -various-
Prerequisite: -none-