
This command models pressure pipe networks using methods and computations as required by the U. S. Environmental Protection Agency and compatible with EPANet software (version 2.2). This network, while using a .util file extension for data storage, is a separate model from utility or sewer networks. A pressure pipe network is made up of water source reservoirs, pumps, pipes, valves, water demand and storage tanks defined by horizontal and vertical alignment (centerline and profile), and parameters associated with the features of the network. The pressure pipe network models can be used in the Collisions Conflict Check command along with sewer and utility network models.
The top of the docked dialog box has thirteen
buttons. Hover over each icon to see its name. Each button is
described as follows:


The Edit button edits the highlighted element from the
pressure pipe network.
The Remove button deletes the highlighted element from
the pressure pipe network. If a valid element is selected, then you
will be prompted to verify the element removal with the following
dialog:

The Report button displays the Report dialog box.

The Data Files Report displays the files and parameters for
each component of the pressure pipe network.
The Min Cover Check Report displays the Reference Surface
and .util files used, and, for each pipe, the minimum cover as well
as the average cover elevation.
The Quantities displays the Carlson Report Formatter,
allowing the user to create custom reports using pressure pipe
network information, import additional information, present the
information in a variety of different formats, and export the
report for other use.
The Output IFC File button creates a file that can be used by other software to import the 3-D model of the pressure pipe network.
The Pressure Pipe Network Settings button displays
a multi-tabbed dialog box, defaulting to the "General" tab. All
pressure pipe network settings from all tabs can be saved to a file
using the SaveAs button. The saved settings are stored in a
.uns file. Any previously stored settings can be loaded using the
Load button. The new settings will not be stored into the
.util file until you press the Save
button on the main docked dialog.

The Reference Surface is a triangulation file that is
used for the min cover calculations and as a reference when editing
pressure pipe profiles. The Auto Zoom to Current
Selection check box finds and zooms to the component
highlighted in the pressure pipe network tree. Highlight
Current Centerline provides visual choices for in-drawing
indication of the pressure pipe network component which has been
selected.

On the "Plan View" tab, the Text and Symbol Size
Scalers are used to set the size of pressure pipe network text
and symbols for the Draw Plan View function. Clicking the
"Set" button next to the Text Style field controls the font
used for the pressure pipe network. The Label Name
dropdown box allows the user to place the pressure pipe network
component label at either end, at intervals defined in the Label
Interval field, or choose "None" for no labels on
components. Clicking the "Set" button beside The
Pump, Tank, and Reservoir Symbols, selects the 2-D plan view
symbols used for these components.


The Help button displays this document..
Clicking the Draw button displays the Draw dialog
box.

The 3D Polylines function creates a 3D polyline for each pressure pipe line. These polylines are tagged with their pipe size in the same format as the Assign Pipe Data to Polyline command.
The 3D Faces function draws each pressure pipe line as a 3D pipe using 3D faces. These 3D faces can then be used in the 3D Viewer commands.
The Plan View function draws a 2D polyline for each pressure pipe line and labels the line with its' name and connection points.
The Profile function displays the Select Profiles to Draw dialog box.
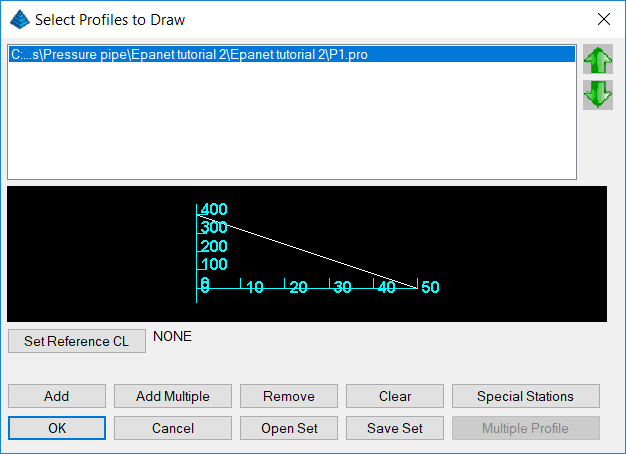
Set Reference Centerline allows the selection of a
Centerline file to choose a Profile file. Add allows
the selection of a Profile file. Add Multiple allows the
selection of more than one Profile file choice at a time.
Remove deletes a Profile from the list. Clear
removes all Profiles from the list. Special Stations
allows Station marks and elevation information to be displayed at
other positions on the profile than at the beginning, end, and
connection points by adding a new Station. Save Set
saves the list of profiles to a user defined file name for
recall. Open Set opens a previously saved Set.
Multiple Profile allows the manipulation of Profile files
containing more than one Profile.
Selecting the EPANet button displays EPANet Actions dialog box and defaults to the "Hydraulics" tab.

The Analysis Method dropdown box allows the selection
of one of three methods supported by EPANet.
The Units dropdown box allows the selection of the desired
volume per time unit.
The 2D Junction Tolerance allows the user to insert a 2D
distance. Like pressure pipe network entities within the 2D
tolerance will be joined even if the 3D elevation does not exactly
match.
EPANet Times Tab
The "Times" tab allows setting parameters for either a single time
period or an extended analysis.

If Time Period Analysis - Single is selected, all other
fields on the tab are deactivated, setting up a "snapshot" analysis
of the pressure pipe network.
If Time Period Analysis - Extended is selected, all fields
on the tab are available for edit. Total Duration is
the total length of time to be analyzed. Water quality is not
currently being analyzed in Carlson 2019. Quality Time
Step is not currently used. Pattern Start Time is
the time the Demand Patterns created and listed on the
"Demand Patterns" tab starts. Report Start Time is the first
time shown on the analysis. Hydraulic Time Step is the
time unit incremented as the analysis proceeds through the
Total Duration. Pattern Time Step is the time unit
used to step from one Demand Pattern to the next.
Reporting Step Time defaults to the Hydraulic Time
Step unless and different increment is assigned in this
field. Clock Start Time is when the analysis
begins. The Statistic controls how information is
presented in the Analysis report. None reports
data at each Reporting Time Step increment or, if zero, the
Hydraulic Time Step. Average reports the
average values found for the Total Duration.
Minimum reports the minimum value, Maximum reports
the maximum value and Range reports minimum and maximum
values across the Total Duration.
The "Demand Patterns" tab allows the weighting of water demand
assigned to connections and laterals when creating the pressure
pipe network based on time of day.

Select an existing pattern to be used to weight the demand during
different times of the day. To add a new Pattern, pick the
Add button. Another dialog is shown to enter the parameters. Type a
new Pattern ID, a new Description, desired
Multipliers and click OK.
In the example above, the Clock and the Pattern start at midnight
and the demand is reduced by the Multiplier 0.50 until the
Pattern Time Step increment comes due at 6am, increasing the
demand by 1.3. At noon, demand drops to its' default values,
then at 6pm demand is increased by a factor of 1.20. Note
that the Pattern Time Step and the number of
Multipliers are synchronized.
Add/Edit EPANet
Curves
Next, develop a pump curve by clicking the Curve button. By
specifying the Type, the values in the X and Y columns are
defined.


The Curve Type Pump develops a single-point or multi-point
Pump Curve plotting volume per unit time (flow rate)
in the X column, head in the Y column. An Efficiency Curve
plots a pump's flow rate in the X column vs. energy use efficiency
as a percentage in the Y column. A Volume Curve plots
flow rate in the X column vs. the change in elevation (head) in a
tank and is used to model tanks with non-uniform cross
sections. A Headloss Curve plots the flow rate in the
X column vs. the headloss in feet or meters in the Y column as
water flows through a General Purpose Valve.
The Analysis button produces a report that can be viewed,
saved, printed and search showing demands, flow rates, head, energy
consumption, pressures, velocities and headlosses in the Network,
either as a snapshot or with a Demand Pattern applied.
The Export button creates a file which can be imported into
EPANet.
The Save button saves any changes made to the current
.util file.
The SaveAs button prompts for a new .util file and saves the current pressure pipe network and settings .
| Converted from CHM to HTML with chm2web Standard 2.85 (unicode) |


