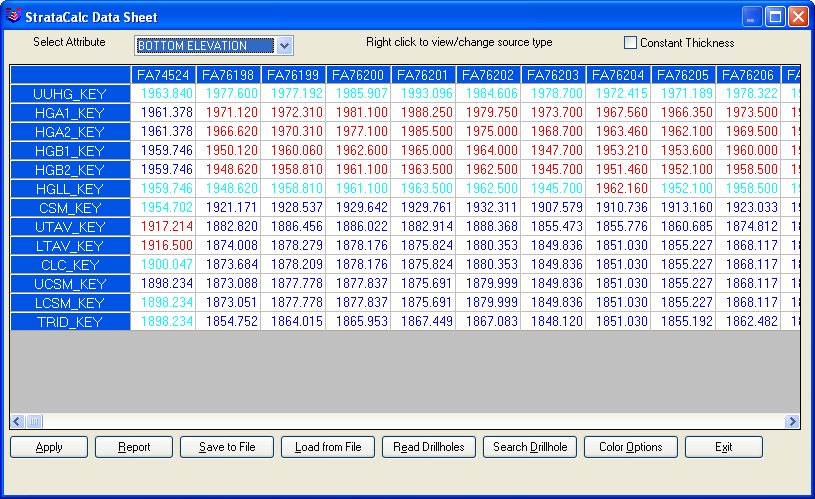
This command displays geological
data for viewing and editing of the processed values in a
spreadsheet view. It could be called an interpolator, as it
displays the values that the program interpolates and will use for
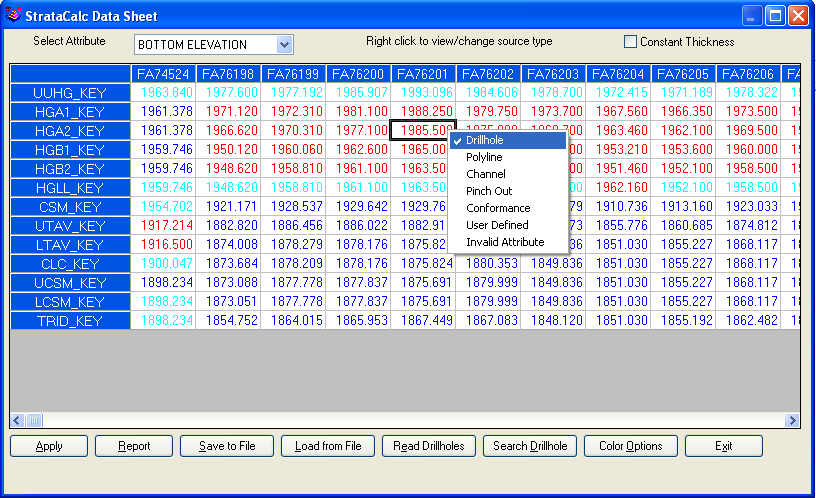
modeling. Each value can be editing and "forced" or user defined
values can be used instead of what is found in the drillhole, or
modeled by the program. Each column represents a datapoint, such as
a drillhole. The color of each text value represents the source of
the data. This StrataCalc file (*.STC) will then be used for the
modeling. Any time the program prompts "Select Drillholes", if none
are selected and Enter is chosen, then the program will ask for the
StrataCalc file. It will use this file and the values in it for the
modeling. This is a great tool for controlling the geology. If a
few drillholes are troublesome and not modeling correctly, the user
can edit this file to what they want to use and create a more
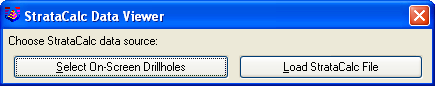
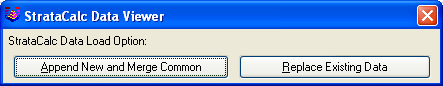
accurate model. The first window is to choose the source of the
data, either the drillholes on screen, or to load an existing STC
file. Then the Data Sheet comes up for viewing and editing.