2. Assign the target design elevation using a method from the Grade menu.
3. If station-offset are needed, use a method from the Centerline menu.
4. Run Report > Create Report.
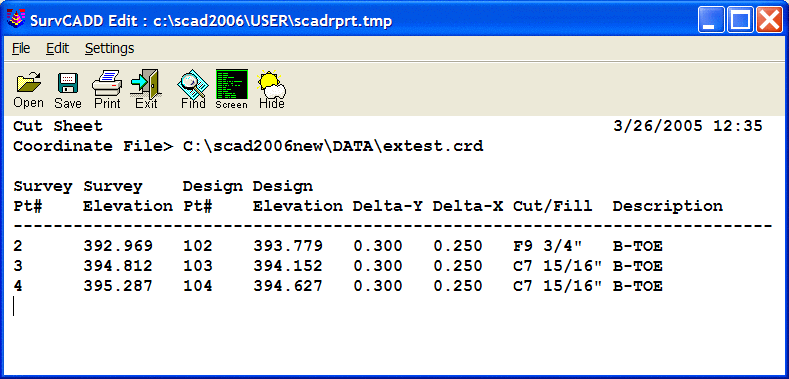
5. Run File > SaveAs to save the cut sheet data.
This command creates a report of the horizontal distance and
elevation difference between points and a design. The design
elevation can be defined by a grid file, triangulation file, 3D
polyline, section file, note file, road template file, runway
airway clearance or design points. The station and offset of the
points can also be reported when a centerline is applied.
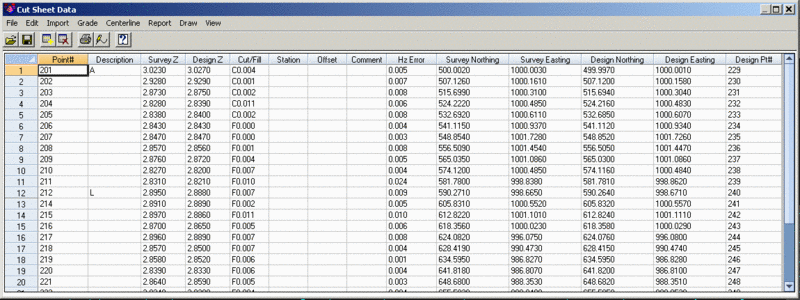
The data for the cut sheet is shown in a spreadsheet. You can edit or enter data in all the fields except for the Cut/Fill and Hz Error fields which are calculated. The cut sheet data can be saved and loaded with a .CUT file. The functions for processing the data are in the pull-down menus. Here's an outline of a typical workflow:
1. Import the survey data using Import > Points, or Import
>SurvCE.
2. Assign the target design elevation using a method from the Grade
menu.
3. If station-offset are needed, use a method from the Centerline
menu.
4. Run Report > Create Report.
5. Run File > SaveAs to save the cut sheet data.
File > Open: Loads
data from a .CUT file.
File > New: Clears the
spreadsheet.
File > Save: Saves the
spreadsheet data and report format settings to the current .CUT
file.
File > SaveAs: Prompts
for a .CUT file and saves the data.
File > Exit: Quits the
program.
Edit > Undo: To under the last edit in the
spreadsheet.
Edit > Delete Row: Deletes the currently highlighted
spreadsheet row. You can also use the Delete key to delete the
current row.
Edit > Insert Row:
Inserts a new row above the current row. You can also use the down
arrow key from the last row to add rows to the bottom of the
spreadsheet, and use the Insert key to add a row above the current
row.
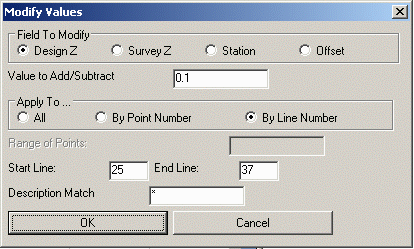
Edit > Modify Values: Changes values in the spreadsheet
for the elevation, station or offset. In the dialog, set the amount
to add or subtract (use negative value to subtract) and set which
field to modify. There are controls for whether to update all the
values or by point number range or by line number range. The
Description Match is a way to filter which values to update.
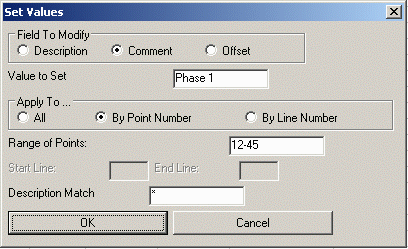
 Edit > Set Values: Sets
values in the spreadsheet for the description, comment or offset
field. In the dialog, choose the field to set, the value and which
rows to set.
Edit > Set Values: Sets
values in the spreadsheet for the description, comment or offset
field. In the dialog, choose the field to set, the value and which
rows to set.
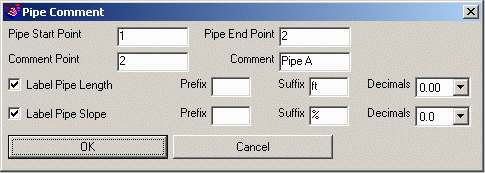
 Edit > Set Pipe Command:
This function fills in a Comment record of length and slope (ie
"81.00ft – 15” RCP @ 2.4%") using the distance and slope between
two points. The two points to use and the formatting options are
set in this dialog.
Edit > Set Pipe Command:
This function fills in a Comment record of length and slope (ie
"81.00ft – 15” RCP @ 2.4%") using the distance and slope between
two points. The two points to use and the formatting options are
set in this dialog.
Edit > Cut: Blanks out the data for the currently
highlighted cells and puts this data into the Windows
clipboard.
Edit > Copy: Copies the
data for the currently highlighted cells into the Windows
clipboard.
Edit > Paste: Puts data
from the Windows clipboard into the spreadsheet starting at the
currently highlighted cell.
Import > Coordinate File: Imports survey data from a coordinate file for the Point#, Northing, Easting, Survey Z and Description fields of the spreadsheet. This function first prompts for the coordinate file to import. Then there is a dialog to choose whether to select the points by point number range, by selecting point entities from the drawing, or by screen picking points. The Description Match and Ignore Zero Elevations are options for filtering out points.
Besides reading the coordinate data, this import function can
also read station/offset data from the point descriptions by
looking for values after the prefixes defined in this
dialog.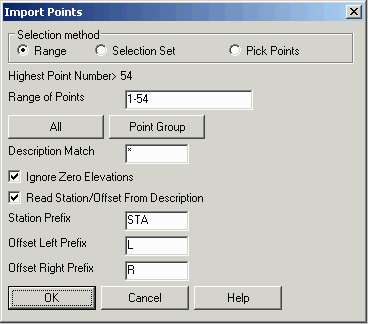 Import > Point Text File: This
method is similar to Import by Coordinate File except a text file
is used instead of a CRD file. The text file should have one point
per row with fields for the northing, easting, elevation,
description and point number.
Import > Point Text File: This
method is similar to Import by Coordinate File except a text file
is used instead of a CRD file. The text file should have one point
per row with fields for the northing, easting, elevation,
description and point number.
Import > Note File:
This method reads the survey data along with the grade elevation
from the note (.NOT) file that is associated with a coordinate
file. For example, if the coordinate (.CRD) file is job3.crd then
the note file name is job3.not. In Carlson Software's data
collection programs (SurvCE and Field), there is an option to store
stakeout data to the note file under the Stakeout options. When
storing a point in the stakeout routines (using SurvCE or Field),
the target point number, coordinates and elevation can be stored to
the note file. This results with the as-staked coordinate stored in
the coordinate (.CRD) file and the target coordinate stored in the
associated note file. The Cut Sheet report can display this
stakeout data using the Stakeout Point Comparison report option.
The horizontal difference between the staked point and the target
point can be reported in Bearing-Distance, Delta X-Y or
North-South-East-West format. Also, in SurvCE and Field, the
elevation difference routines can record the design grade elevation
and station-offset to the note file when a point is stored to the
coordinate (.CRD) file. This grade data can be reported using the
Grade Elevation Report option. The note file records that the Cut
Sheet report uses are TARGET_X, TARGET_Y, TARGET_Z, TARGET_DESC,
TARGET_PT, STATION, OFFSET, VOFF1 and VOFF2.
Import > RW5 File: This
method imports cut sheet data from a RW5 file of measurement data
created by SurvCE. The stakeout functions in SurvCE store all the
data needed to fill out the whole cut sheet including the survey
data, design data and station-offset.
Import > SurvCE Cut
Sheet: Imports data from a SurvCE Cut Sheet file (.CSV or
.TXT). The setup for these cut sheet files in SurvCE is under File
> Job Settings > Stake > Cut Sheets.
Import > TDS Raw: Imports data from a TDS RAW or RW5 file
by reading the TDS stakeout records.
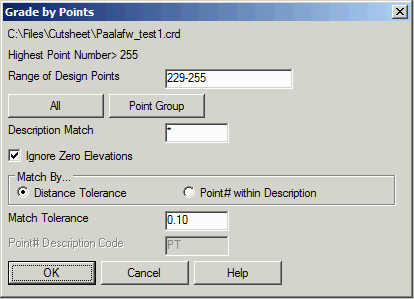
Grade > Points: The
reference points to compare can be in the same coordinate file or a
separate file. The reference/design points need to be matched with
the survey points. The Match By Distance Tolerance method matches
the design point that is closest to the survey point and within the
specified Match Tolerance. The Point# Within Description method
looks for the specified Point# Description Code in the descriptions
of the design points and gets the survey point number from the
suffix of the description code. When the Point# Description Code is
found, the number after this code is used as the point# to match
from the other file. For example, if description code is "PT" and
the description for point# 101 in the first coordinate file is
"CURB PT303", then point# 303 from the second coordinate file is
used for the match. For the separate file option, there is a third
method to match points between the files which is to use point
numbers to match points between the files. The Match By Manually
method has a dialog for picking pairs of point numbers for the
survey and design to add. The list of available survey points to
match with comes from points in the spreadsheet that have Point#,
Survey Northing and Survey Easting but not the design data.
 Grade > Triangulation File: the
design elevation is determined by the elevation of the
triangulation surface at each point.
Grade > Triangulation File: the
design elevation is determined by the elevation of the
triangulation surface at each point.
Grade > Grid File: the
design elevation is determined by the elevation of the grid surface
at each point.
Grade > 3D Polyline:
When using a 3D Polyline
for the grade elevation, the program calculates the elevation along
the 3D polyline at the position perpendicular from the point
selected. This calculated elevation is then compared to the
point(s) selected to determine the cut/fill values.
Grade > Cross Sections:
With Section Files, the
grade elevation is interpolated from the offset-elevation data in
the section file based on the station-offset of the point along the
centerline. When using this method, a centerline file (*.cl) must
be specified for station-offset data.
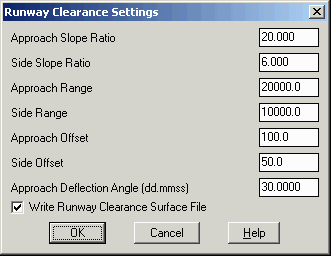
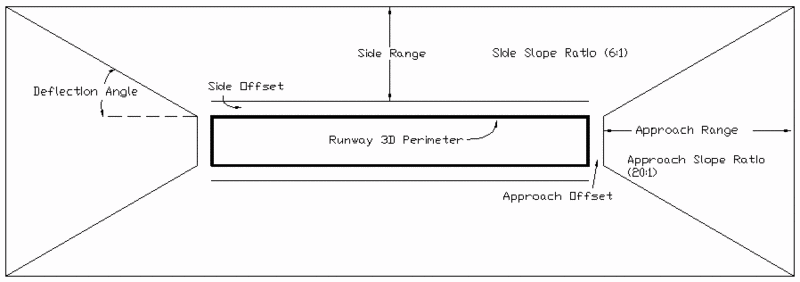
Grade > Runway
Clearance: This option defines the target surface as the
airway clearance around a runway. This method is for clearance
reports for tree and building tops by comparing points to this
runway clearance surface. The runway surface is built from a 3D
perimeter polyline of the runway along with slopes for the approach
lanes and runway sides. The runway sides are offset level from the
runway perimeter for the specified distances before starting the
slopes. The parameters for the runway are defined in the dialog and
illustrated in the graphic shown here. The Write Runway Clearance
Surface File creates a triangulation surface file that you can draw
or inspect for verification of a correct target surface.
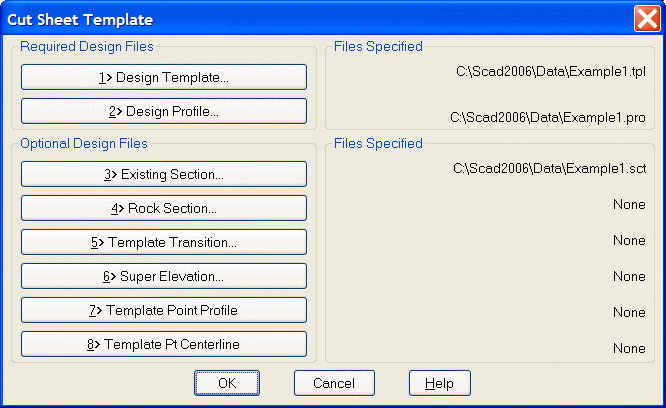
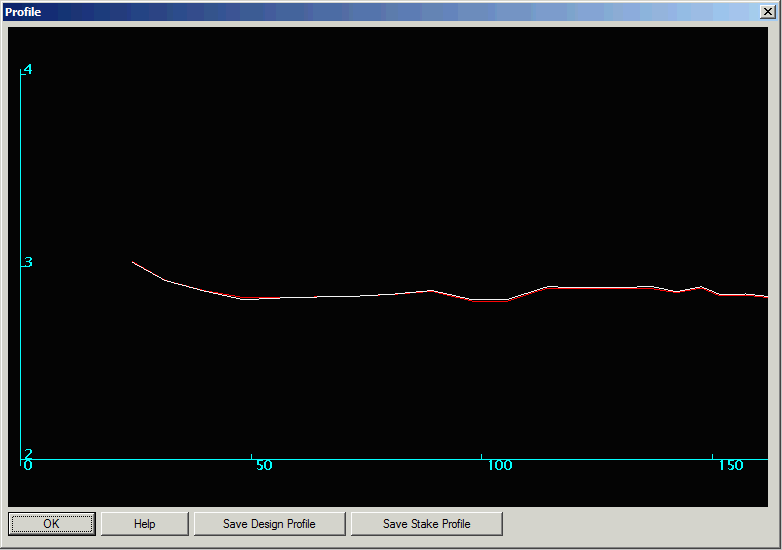
Grade > Road Design: This option defines the grade elevation using road design files. For each point, the program finds the station-offset for the point along the centerline and then applies the road design at that station to determine the grade elevation. Grade to Process is used to define the surface to use for the cut sheet comparison. These grades are defined as Top Surface, usually final grade, or subgrades and correspond to the defined grades and subgrades within a template file. The required design files include a centerline (.CL) file, a template (.TPL) file, and a profile (.PRO) file. There are also several optional design files such as Superelevation, Template Point Profile and Template Point Centerline. The design files are created in the Civil Design module. Using the design files in Cut Sheet is similar to the Process Road Design command.
Centerline > Centerline
File: This function assigns the Station and Offset fields in
the spreadsheet by prompting for a centerline file (.CL) and
locating each point along the alignment.
Centerline > Polyline:
This function assigns the Station and Offset fields in the
spreadsheet by picking a polyline, entering the starting station,
and locating each point along the alignment.
Centerline > Points:
This method defines the alignment by entering two points to define
a line.
Report > Create
Report: This function display a report of the cut sheet data
using the current report settings. When Use Report Formatter is
off, the report is shown directly in the standard viewer.
Otherwise, the Report Formatter dialog is shown for customizing the
report and outputting to different formats such as Excel.
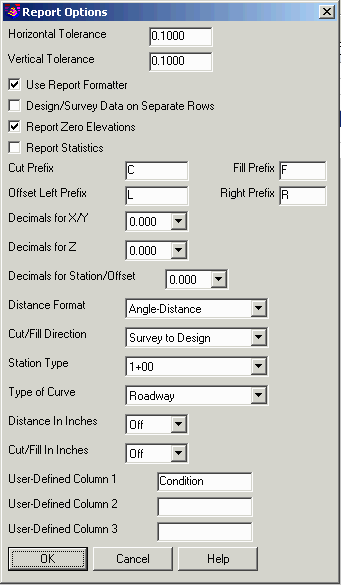
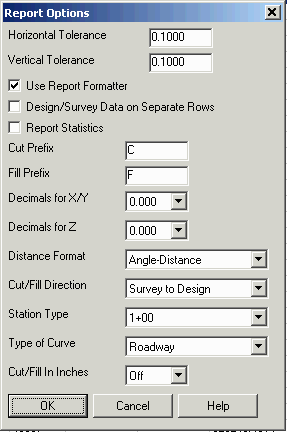
Report > Report
Settings: There are several settings for the report
including decimal precision, prefix for cut and fill and distance
units. For the Horizontal and Vertical Tolerance, the report
highlights any points that exceed these tolerances. The Distance
Format chooses between Angle-Distance, Delta X/Y, and
North-South-East-West deltas. The Cut/Fill Direction chooses
whether to report cut/fill as Survey relative to Design or vice
versa.
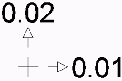
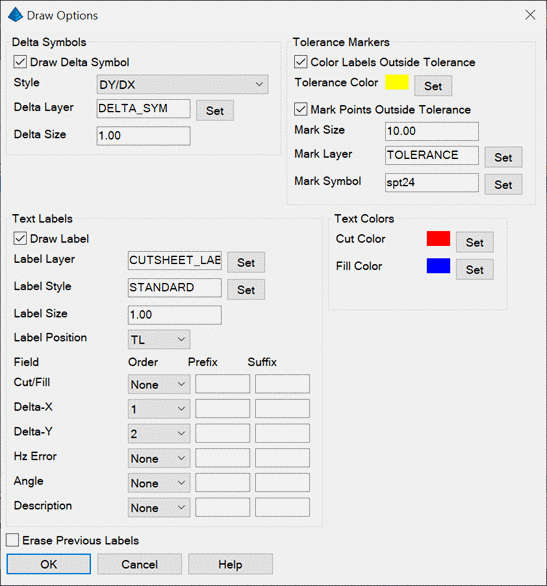
DX/DY symbol style
 Delta
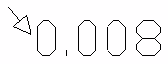
Distance symbol style with Hz Error text label
Delta
Distance symbol style with Hz Error text label
 View > Hide By Point Numbers: This
function is a way to filter the spreadsheet by point numbers. The
function prompts for a range of point numbers and then only
displays those points in the spreadsheet.
View > Hide By Point Numbers: This
function is a way to filter the spreadsheet by point numbers. The
function prompts for a range of point numbers and then only
displays those points in the spreadsheet.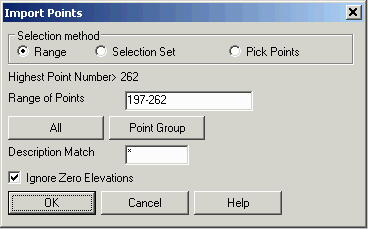 2) Run Grade > Triangulation File
and choose sample_cutsheet.tin from Carlson Projects.
2) Run Grade > Triangulation File
and choose sample_cutsheet.tin from Carlson Projects.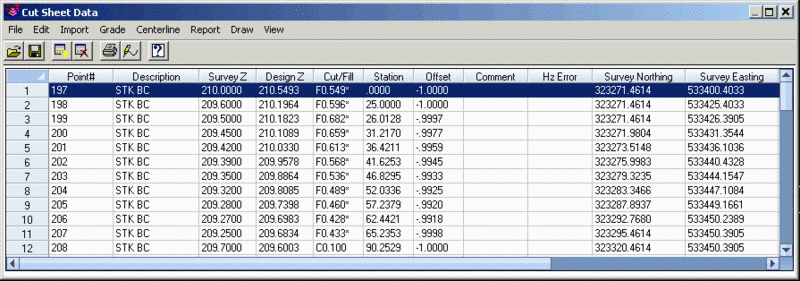
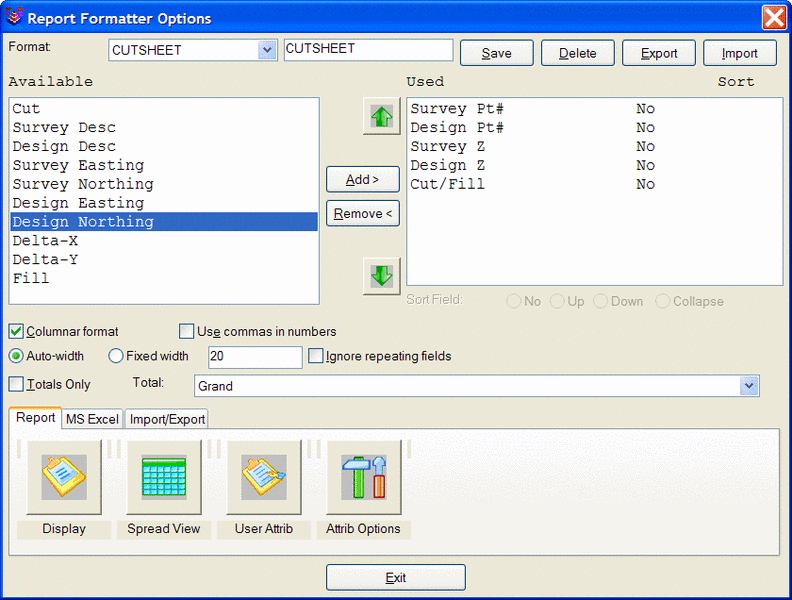
 5) The next steps will format the
report. Run Report > Create Report which brings up the Report
Formatter. Move the Available fields over to the Used fields list
as shown. Also, be sure that Widths by Field is toggled on.
5) The next steps will format the
report. Run Report > Create Report which brings up the Report
Formatter. Move the Available fields over to the Used fields list
as shown. Also, be sure that Widths by Field is toggled on.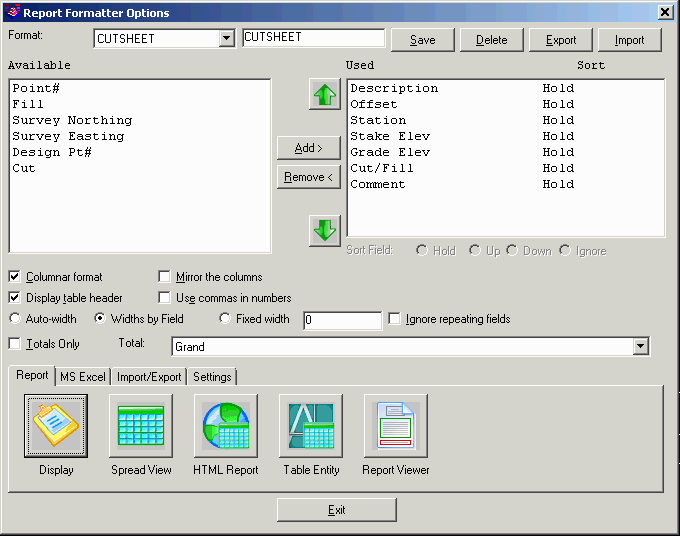 6) On the Report Formatter dialog,
pick the Settings tab and then the Attrib Options button which
controls how the values are formatted in the report. Then on the
Attribute Options dialog, highlight Description and pick the Edit
button. On the Attribute Display Options dialog for Description,
turn off Auto Width and set the Fixed Width to 18. Then pick OK.
Next highlight Comment in the list and pick Edit. Set the Fixed
Width to 21 for Comment. Then pick OK on the Attribute Options to
finish the attribute edits.
6) On the Report Formatter dialog,
pick the Settings tab and then the Attrib Options button which
controls how the values are formatted in the report. Then on the
Attribute Options dialog, highlight Description and pick the Edit
button. On the Attribute Display Options dialog for Description,
turn off Auto Width and set the Fixed Width to 18. Then pick OK.
Next highlight Comment in the list and pick Edit. Set the Fixed
Width to 21 for Comment. Then pick OK on the Attribute Options to
finish the attribute edits.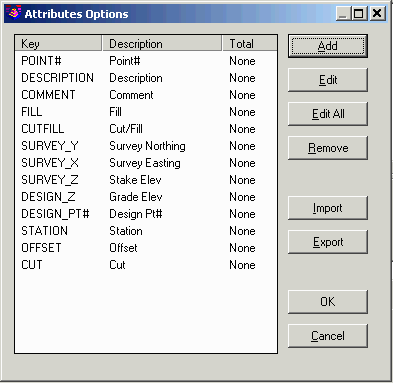 7) On the Settings tab for Report
Formatter, pick the Field Options button which setups up the report
header and footer. On the Field Options dialog, pick Import and
select sample_cutsheet.fds from the Carlson Projects\Settings
folder. Then pick OK.
7) On the Settings tab for Report
Formatter, pick the Field Options button which setups up the report
header and footer. On the Field Options dialog, pick Import and
select sample_cutsheet.fds from the Carlson Projects\Settings
folder. Then pick OK.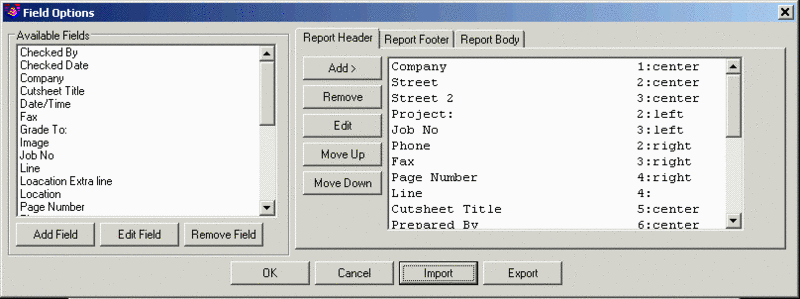 8) On the
Report tab for Report Formatter, pick the Report Viewer button.
There is a dialog for setting the report page size. Pick OK.
8) On the
Report tab for Report Formatter, pick the Report Viewer button.
There is a dialog for setting the report page size. Pick OK.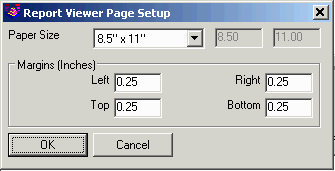 Next is a dialog for entering report
fields for the report header as setup in the previous step with the
Field Options. Fill in the report fields and then pick OK.
Next is a dialog for entering report
fields for the report header as setup in the previous step with the
Field Options. Fill in the report fields and then pick OK.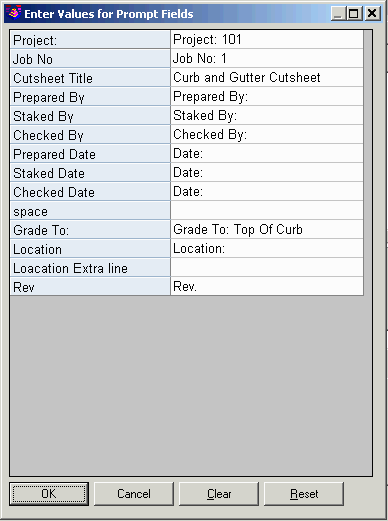 Now the report is displayed in the
Report Viewer which can be printed or saved to PDF, MS Word or
Excel.
Now the report is displayed in the
Report Viewer which can be printed or saved to PDF, MS Word or
Excel.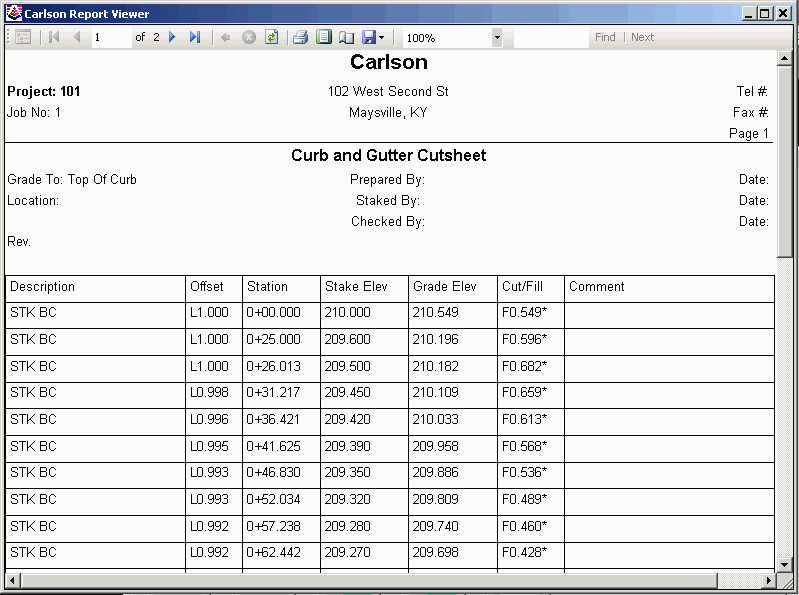
|
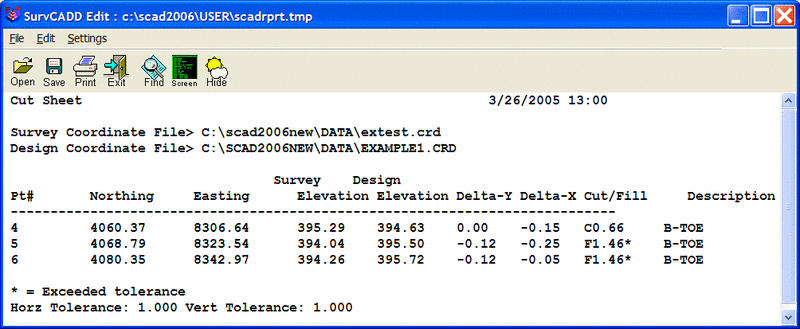
| Example 2: Cut Sheet Report comparing points from the Current Coordinate File and with the Use Feet-Inches For Cut/Fill options on. |
|
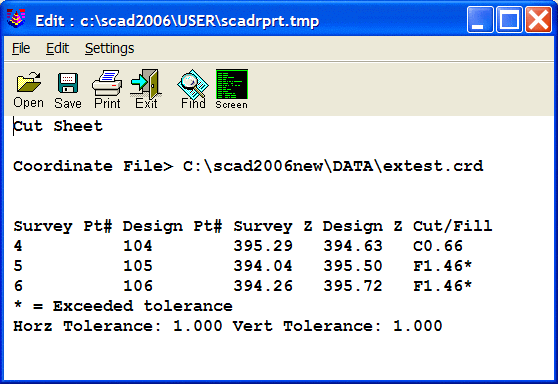
| Example 3: Cut Sheet Report comparing points from Another Coordinate file, reporting coordinates for the points. |
Example 4: Steps for Comparing Points in Current Coordinate file and using Report Formatter Option to customize report output to user preference.
1) Check on Use Report Formatter on the Cut Sheet Report
dialog.
2) Specify points to compare by one of the four methods described
above for comparing points within the current coordinate file.
3) Select report content by highlighting the desired data
from the Available list on the left side of the dialog box and then
pressing the Add button to place the selected data in the Used
list. Standard window selection methods using the Ctrl and Shift
keys can be used to select more than one item at a time. After
moving the selected data to the Used window it may be necessary to
move data up or down to obtain the desired order of your report. To
do this use the up and down arrows located on the left of the Used
window.
4) When the desired data has been specified in the Used window
press the Display button at the bottom left of the dialog. For more
detailed information on using the report formatter see the Report
Formatter section of this manual.
 Pulldown Menu Location:
Survey
Pulldown Menu Location:
Survey
Keyboard Command: cutrprt
Prerequisite: A coordinate (.CRD) file
| Converted from CHM to HTML with chm2web Standard 2.85 (unicode) |