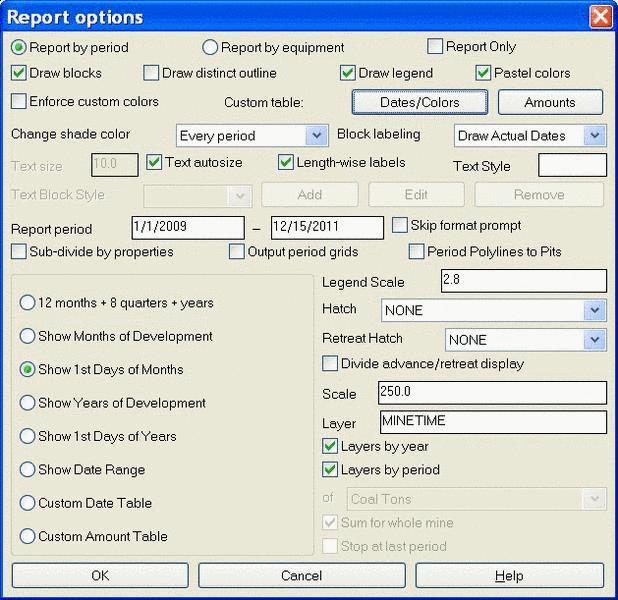
Report Options. Each item on the dialog box is defined below.
Report by period: This option runs the schedule and breaks the pits into blocks by period, such as month or year. The blocks and outlines are colored by period and displayed in the report. The report can be formatted may ways.
Report by equipment: This option runs the schedule and breaks the pits into blocks by Equipment. The blocks and outlines are colored by equipment and displayed in the report. The report can be formatted may ways.
Report Only: Choosing this option will not draw any blocks or outlines on the map. It will go directly to the Report Formatter for viewing of the data.
Draw blocks: When this option is selected, the periods or equipment will be drawn as blocks of solid fill or any AutoCAD hatch pattern that is chosen.
Draw distinct outline: When this option is selected, the periods or equipment will be drawn as closed polyline outlines.
Draw legend: This option draws a legend and the picked location on the map. The colors are based on period, custom amounts or equipment.
Pastel colors: Choosing this option draws the blocks or outlines in the pastel color region of the AutoCAD palette. It uses colors in the 11, 21, 31, 41 etc. row. If it is not selected, then it will use the brighter, primary colors such as 10, 20, 30, 40, etc.
Enforce custom colors: Selecting this option will use the custom color palette the is setup with the Custom Dates and Colors Table.
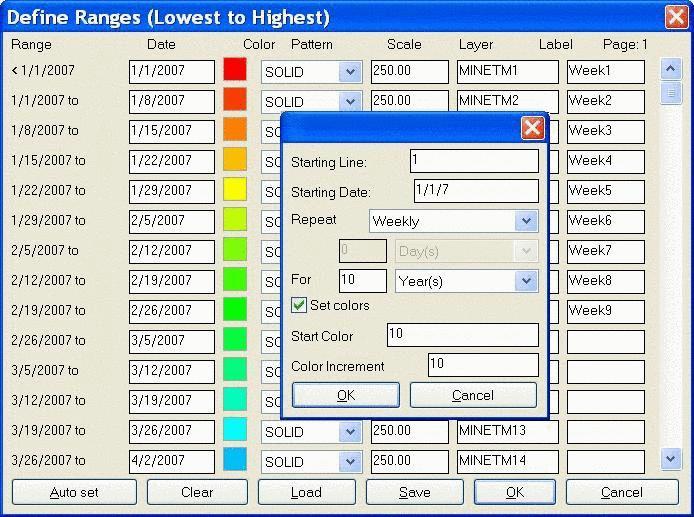
Custom table: Dates/Colors: This brings up the Define Ranges screen. This is where a custom date or color table can be set up. The Auto set button will bring up the smaller window for entering the starting line (row number), starting date, how often to repeat, and how long to keep repeating. The Set colors will prompt for a starting color, and the color number increment. The colors are set by picking the color box. The Pattern is the pattern of the hatch in the blocks. The Scale is the size of the hatch patterns if a hatch is used. The Layer is the AutoCAD Layer of the period. Finally, the Label is what each period will be called for reporting and labeling. The example shown here has created a weekly schedule with custom colors. The Clear button wipes out the data for starting over. The tables can be saved and loaded as CDT files. To use this option, choose Enforce Custom Colors or Custom Date Table.
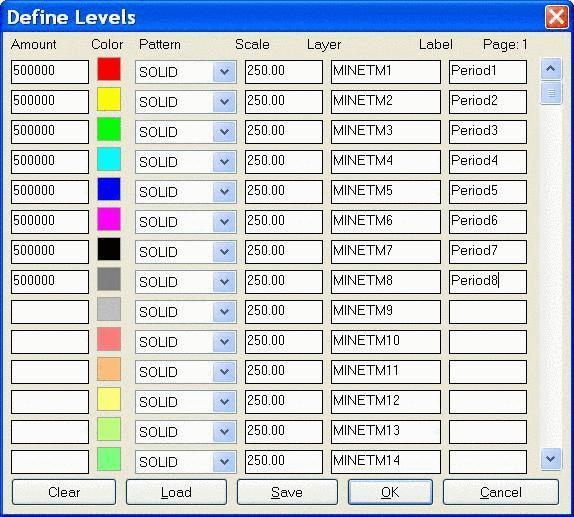
Custom table: Amounts: This button brings up the Define Levels window. This is where the amount to target is set for the Custom Amounts option in the report. The amount to target is set in the first column. The next column is the color for the blocks and outlines. The colors are set by picking the color box. The Pattern is the pattern of the hatch in the blocks. The Scale is the size of the hatch patterns if a hatch is used. The Layer is the AutoCAD Layer of the period. Finally, the Label is what each period will be called for reporting and labeling.
Change shade color every: This option will change the color/layer of each block or outline. There are 3 choices. Every Period (what is selected below), Year, or 5 Years.
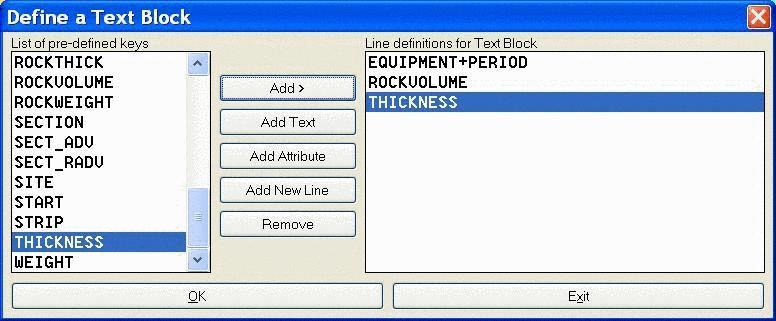
Block labeling: This pulldown is for setting the labeling options. There are 5 options here. No Block Labels will not draw any labels. Draw Actual Dates will draw the date of each period. Draw Period Names will place the period name in the block that is entered in the custom date table. Use Custom Names draws the names entered in the custom amount table. Use Custom Text Block activates the Add, Edit and Remove buttons. Choosing Add or Edit will bring up the input screen for arranging the text items in the block. First, give the new block a name. Then move items from the left side to the right, in the row desired. The Add Text button allows for custom text for prefix or suffix entry. The Add Attribute adds any attributes that exist in the schedule. Add New Line moves the added item to the next row. If this is not selected, then the next item is added to the same row, with a + as a separator. Remove will move the entire row from the Line definitions.
Text Size/Text autosize: This will either place all text in the map with the defined size, or autosize it to fit in the block dimension.
Length-wise labels: This option draws the text parallel with the long axis of the pits. If it is not selected, then the text will be 90 from the long axis.
Text Style: Enter in an AutoCAD text style for labels.
Text Block Style: This section is active if the Block labeling is set to Use Custom Text Block. Any premade blocks will appear on the list and may be selected for text orientation.
Report Period: This is the start and finish date of the report. By default, the program will display the full range from the start date to the final date it needs to finish. Any date range in the middle may be used.
Skip format prompt: If this option is selected, then after the blocks are drawn, a report will appear that is similar to the last one created. The program will not bring up the report formatter for customizing.
Sub-divide by properties: If this is selected, the schedule will recognize any named Carlson property lines drawn on the mineplan. In the report, the periods can be further subdivided by property and owner. These are the same property lines that are used in Underground Mine Reserves.
Output period grids:
Choosing this option will create a grid file of the 3D surface at
the end of each period. It needs the Surface Grid and the Bottom of
Pit Grid. It needs at least the Bench 1 Grid filled in to make the
grids. Finally, create a new output grid path with a prefix to
create new grids of each pit. A new grid file is then written of
each pit and bench. This can be an "ultimate pit" used in other
design work. It doesn't have the flexibility of other commands such
as Design Bench Pit. It uses a constant highwall slope of
around 80 degrees. Disregard for underground mining.
Period Polylines to Pits: Selecting this option creates and names the outlines as Carlson pits. The names of the pits are the actual period names. This is useful if these period polylines need to be saved and re-run in the Surface Mine Reserves for additional quantities or analysis. Disregard for underground mining.
12 months + 8 quarters + years: A schedule run with this option will break down the first year into 12 monthly periods, the next two years into 8, 3 month quarters, and the remaining periods will be full years.
Show Months of Development: This method will use the starting day and increment by month to the same day. For example, if the starting day is on the 12th of each month, the schedule will be from the 12th to the 12th for each month.
Show 1st Days of Months: This method will use the starting day and increment to the first of each month. For example, if the starting day is on the 12th of the first month, it will go to the end of the first month and then start fresh on the 1st of each month.
Show Years of Development: This method will use the starting day and increment by year to the same day. For example, if the starting day is on June 15th, the schedule will be from June 15th to the next June 15th.
Show 1st Days of Years: This method will use the starting day and increment to the first of each year. For example, if the starting day is on June 15th, it will go to the end of the first year and then start fresh on the 1st of each year.
Show Date Range: This option is used to just display a period as a partial range. Enter a range above in the Report period windows. Then when the sequence is run, only that period will be hatched all in the same color and time.
Custom Date Table: When a custom Date/Colors table is defined, this option must be selected to use it. Custom Dates/Colors are defined above.
Custom Amount Table: When a custom Amount table is defined, this option must be selected to use it. Custom Amounts are defined above.
Legend Scale: If the Draw Legend box is selected, this is the size of the legend. Sizes from 50-100 should appear legible for most mine plans with a dwg scale of 50.
Hatch: This is the hatch that is used for drawing in the blocks if the custom date or amount tables are not used. All hatch patterns appear on the list, the most common one, solid, appears at the top of the list for easy selection.
Retreat Hatch: This is used for underground retreat hatching. This provides the user the opportunity to create a different pattern for second mining than advance. Note that longwalls are treated as mining on the advance.
Layer by year: The blocks and outlines will be layered by year. The year will appear as a suffix to the layer name.
Layer by period: This option will put each period on its own layer. If there are many periods, it will create many layers which can be a hassle.
Of, Sum for whole mine & Stop at last period: These options are only active when using the Custom Amount Table. The "Of" window is for selecting what is being target for custom amounts. The options are similar to Surface Production Timing: Total Tons, Key Tons, Waste Tons, Total Area, Mined Area, Total Volume, Waste Volume, and User Grid. Sum for whole mine will keep a running total for summation in the report. Stop at Last Period will end the schedule at the last entered row in the Custom Amount Table entered above.
Pulldown Menu Location: AdvMine > Underground, Adv
Mine > Surface
Keyboard Command: set_report