Slope Zone Analysis
This command calculates the surface area of a site in different
slope zone ranges. This command can use either a surface model
file, (.TIN, .GRD, or .FLT), contour polylines, or 3D Face drawing
entities which can be generated by the Plot 3D Grid File
command, the Draw Triangular
Mesh command, or the Draw Triangulation Faces option of
Triangulate & Contour. For each slope zone, the 3D
Faces can be hatched with any hatch pattern, including the SOLID
pattern, or left empty with the NONE pattern. The command reports
the area for each slope zone. When using a triangulation surface
file, the Save Slope Zone Colors option sets the triangle colors in
the TIN file for the slope zones. Then commands like 3D Viewer
Surface File can visualize the colored surface. When using the
Contours method, the program prompts to select the contour
polylines along with optional points to picking up high and low
points. Using the Contours method along with the option to Draw
Slope Zone Contours with Hatch Slope Zones, the hatch zone
boundaries will follow the contours. The Use Report Formatter
option allows for customized reports and different output
formats.
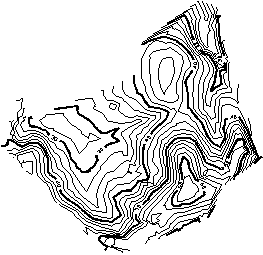
 The Draw Slope Zone Contours option
generates contours of the slope zones based on the calculated slope
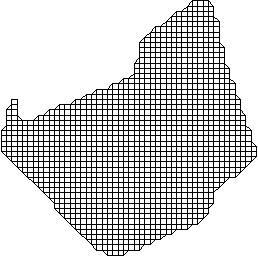
at each point of the 3D Faces. The Output Grid File of Slope option
creates a grid file of the slope values.
The Draw Slope Zone Contours option
generates contours of the slope zones based on the calculated slope
at each point of the 3D Faces. The Output Grid File of Slope option
creates a grid file of the slope values.
There are also options to specify inclusion and exclusion areas.
When inclusion areas are specified, only the slope area within the
inclusion polyline is calculated. Slope area within an exclusion
polyline are not included in the calculations. Inclusion and
exclusion areas are represented by closed polylines and must be
drawn prior to calling this routine. Without inclusion and
exclusion polylines, all the slope area of each selected 3D Face is
used.
Prompts
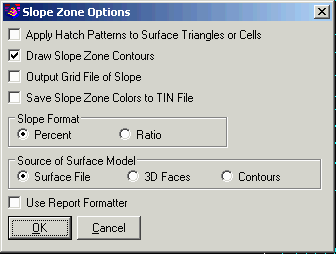
Slope Zone Options dialog
box. Choose whether to Draw Slope Zone Contours,
whether to Output Grid File of Slope, and Slope Format. Pick OK
Select surface model file.
Define Ranges dialog. Specify the slope zones, colors
and patterns from lowest to highest. Pick OK.
Select the Inclusion perimeter polylines or ENTER for none:
select perimeter(s) or
press Enter
Select the Exclusion perimeter polylines or ENTER for none:
select perimeter(s) or
press Enter
Report is generated.
Slope Report


Surface File: C:\scdev\data\SIMO2.grd

Average Slope: 21.6%

Minimum Slope: 0.0%

Maximum Slope: 81.7%

                Horizontal Surface      Slope Surface           % of    Average

Zone  Range     Area S.F.     Acres     Area S.F.     Acres     Total   Slope %

-------------------------------------------------------------------------------

1                769,137.1     17.657    775,379.4     17.800    51.8      11.8

      20.00%

2                583,761.4     13.401    607,257.9     13.941    39.3      28.2

      40.00%

3                113,978.1      2.617    125,967.2      2.892     7.7      46.8

      60.00%

4                 18,494.6      0.425     22,407.7      0.514     1.2      68.3

-------------------------------------------------------------------------------

Total          1,485,371.1     34.099  1,531,012.2     35.147
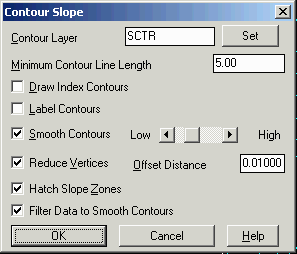
If you choose to draw Slope Zone Contours, the Contour Options
dialog box is presented. There are settings for the contour layer
and whether to label, smooth and reduce the contours. The Hatch
Slope Zones option fills in the slope zone areas with colored
hatching. The Filter Data to Smooth Contours option applies a
filtering algorithm that reduces the noise. The slopes can vary
greatly between neighboring points. When contoured directly, these
slope data points can produce incoherent contours with the
smoothing.
 Note: If you choose to use Screen
entities instead of a surface model file, you are prompted whether
to:
Note: If you choose to use Screen
entities instead of a surface model file, you are prompted whether
to:
Freeze grid layer after processing
[Yes/<No>]?
|
|
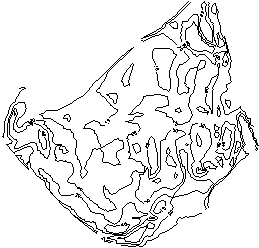
Surface contours |
|
| 3D Faces from a grid surface
model |
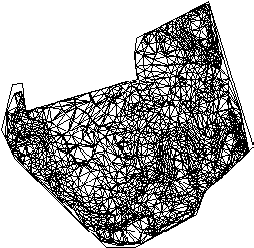
|
| 3D Faces created by Triangulate
& Contour with the Draw Triangulation Faces option |
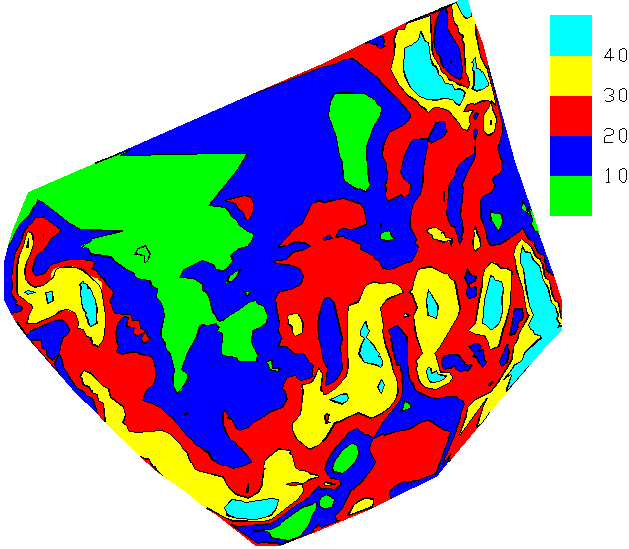
|
| Slope zone contours |
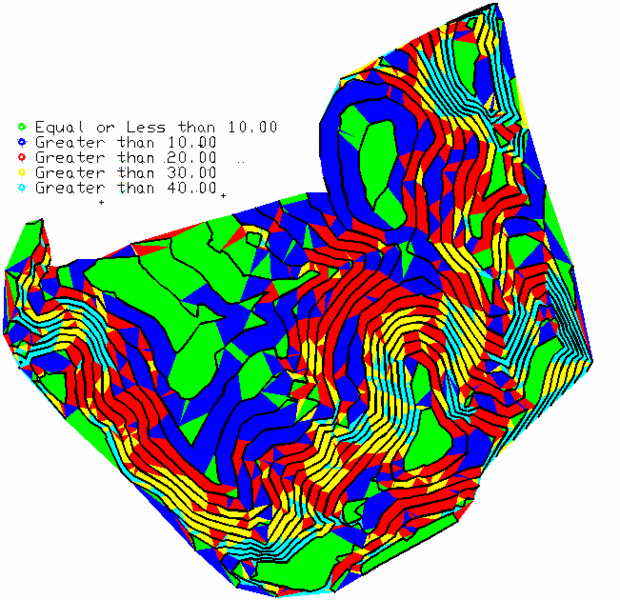
|
| Slope zones that follow the
surface contours using the triangulation 3D Faces |
|
| Hatched slope zone contours
created from the grid 3D Fac |
Pulldown Menu Location: Surface >> Slope
Analysis
Keyboard Command: szone
Prerequisite: Surface model file (.TIN, .GRD, or .FLT), or
3D Faces entities