Elevation Zone Analysis
This command can be used to calculate the surface area of a
surface in different elevation zone ranges and to analyze a surface
by ranges or "zones" of elevation. The program requires 3D Face
entities that can be generated by the Draw 3D Grid File command. The
Draw Triangulation Faces
option in Triangulate & Contour or Draw Triangular Mesh routine under
Surface >> Draw Surfaces menu can also be used to create
triangular 3D Faces. For each elevation zone, the 3D Faces can be
hatched with a hatching pattern, solid filled with the SOLID
pattern, or left empty with the NONE pattern. The 3D Faces are also
placed in a separate layer for each zone.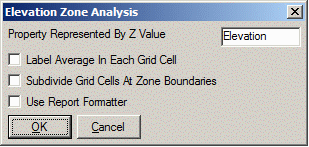 In the options dialog, the Property Represented By Z
Value sets the name used in the reports for the type of surface
model. Label Average In Each Grid Cell creates text labels in the
center of each 3D Face of the surface with the average surface
value. Subdivide Grid Cells at Zone Boundaries gives higher
resolution at the transition between zones. Use Report Formatter
allows for customized report and different output formats.
In the options dialog, the Property Represented By Z
Value sets the name used in the reports for the type of surface
model. Label Average In Each Grid Cell creates text labels in the
center of each 3D Face of the surface with the average surface
value. Subdivide Grid Cells at Zone Boundaries gives higher
resolution at the transition between zones. Use Report Formatter
allows for customized report and different output formats.
There are also options to specify inclusion and exclusion areas.
When inclusion areas are specified, only the area within the
inclusion polyline is calculated. Areas within an exclusion
polyline are not included in the calculations. Inclusion and
exclusion areas are represented by closed polylines and must be
drawn prior to calling this routine. Without inclusion and
exclusion polylines, all the area of each selected 3D Face is
used.
Prompts
Elevation Zone Analysis dialog
Select 3D Faces to
Analyze...
Select objects: pick the 3D Faces to process
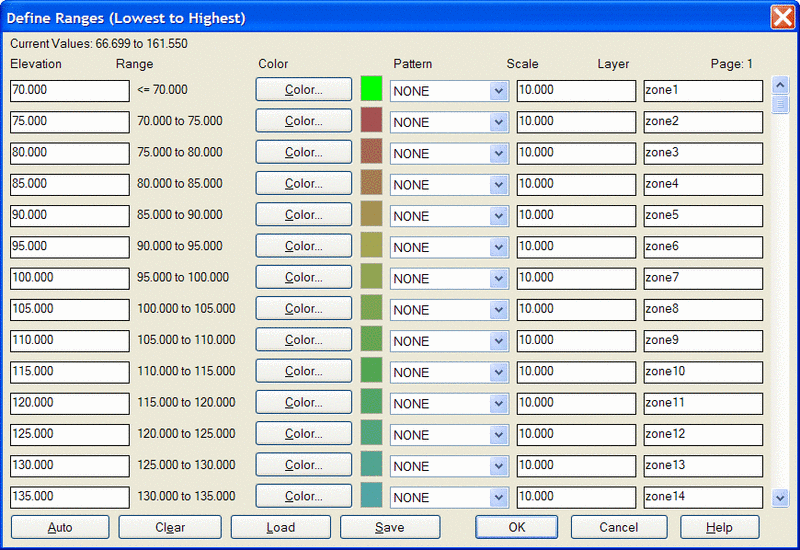
Define Ranges (Lowest to Highest) Dialog
Specify
the elevation ranges, colors and patterns.
Select the Inclusion perimeter polylines or ENTER for none:
Select objects: pick a closed polyline for the limits of
disturbed area
Select objects: press Enter
Select the Exclusion perimeter polylines or ENTER for none:
Select objects: press Enter
Select point for color legend
(Enter for none): pick a point
If a point is picked, a legend showing the color of each range is
drawn. The legend is drawn aligned to the current view UCS.
For this reason it is best to have the mesh at the Vpoint at
which it will be plotted before executing the analysis
program.
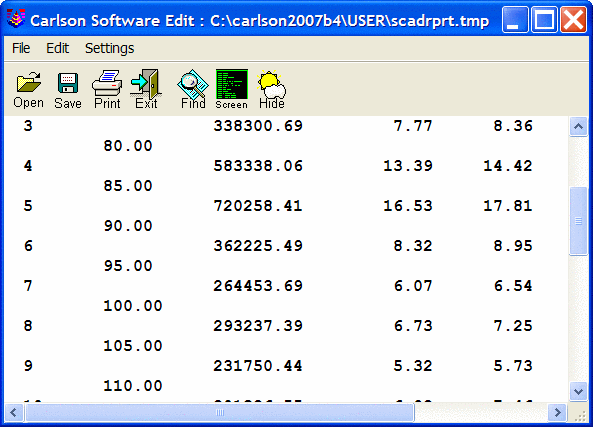
A report is also generated in the standard report viewer.
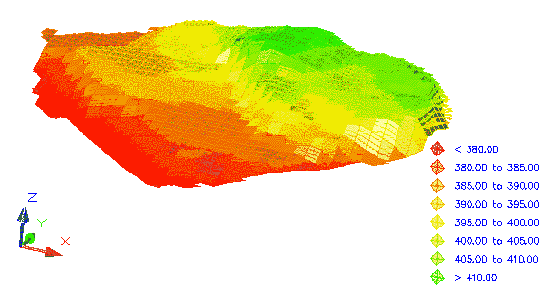
Result of
Elevation Zone Analysis viewed in 3D and shaded
Pulldown Menu Location: Surface
Keyboard Command: elvzone
Prerequisite: displayed 3D Face entities.