This command sets the color of 3D lines by slope range. The
slope ranges are defined in percent slope for up to ten ranges.
There is an option to draw a legend of the slope colors.
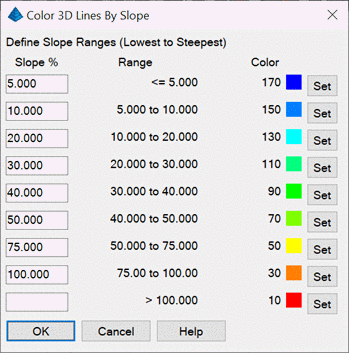
Define Slope Ranges Dialog
Select 3D lines to
color.
Select objects: pick the entities
Draw Legend [<Yes>/No]? Y
Legend size <5.000>: press Enter
Pick point for legend: pick a point
Pull-Down Menu Location: Surface > Slope Analysis
Keyboard Command: color3dline
Prerequisite: 3D Lines