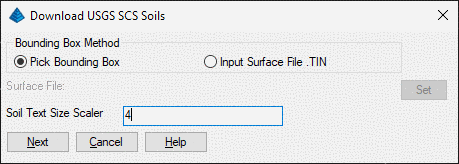
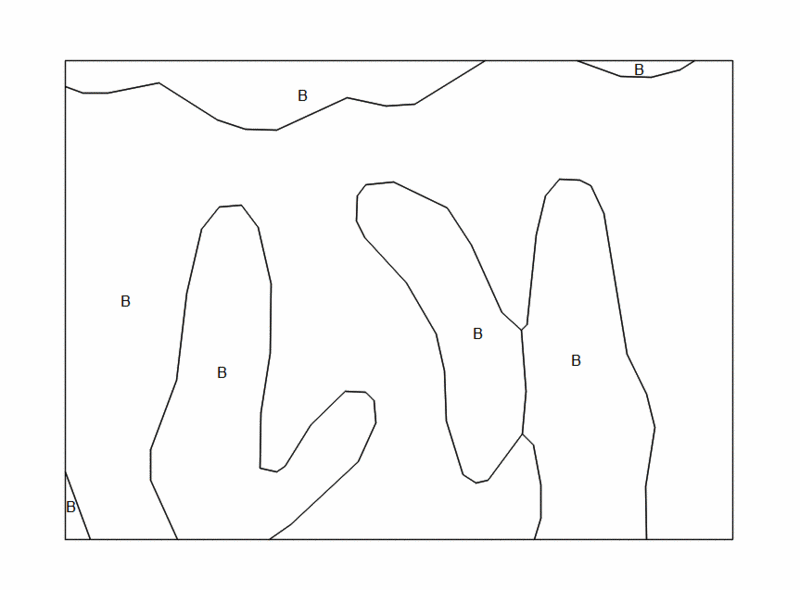
This command downloads soil group index and soil boundary lines
from USGS website, and then draw soil polylines and index labels in
the plan view. These soil lines and labels are then used in
watershed analysis to calculate weighted curve numbers.
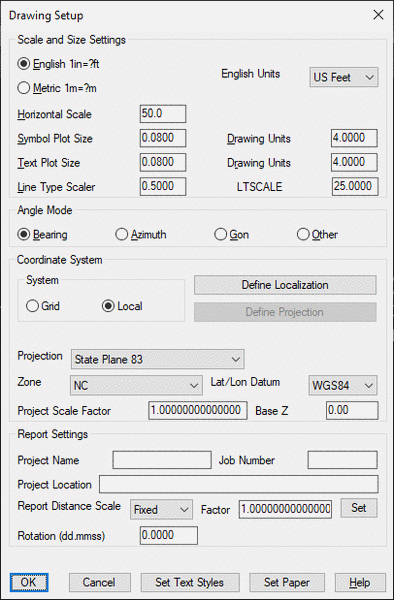
The program requires to define the dwg grid projection in order
to convert the local area to Latitude/Longitudinal values used on
USGS website. Run command Settings > Drawing Setup to set up the
local projection, zone and Lat/Lon datum.
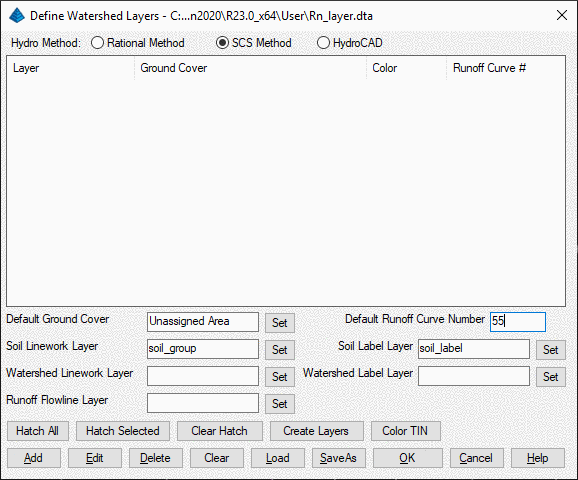
In order to draw soil lines and labels on the drawing for
watershed analysis purpose, it's required to set up the layers for
soil lines and labels. Run command > Watershed > Define
Watershed Layers to set up layers for soil lines and
labels.