Both the Add button and Edit buttons lead to a dialog to define a utility line.
 The
Utility Name is simply the name of the utility line. Each
name must be unique in the utility network.
The
Utility Name is simply the name of the utility line. Each
name must be unique in the utility network.This command models utility networks such as cable, gas and
water lines. This utility network is a separate model from the
sewer network which calculates gravity flows. The utility network
does not have any flow calculations or inlets. The utility network
model is defined by horizontal and vertical alignments (centerlines
and profiles) plus pipe sizes. The utility network has one or more
utility lines. Files with a .util extension are used to store the
utility network model. Profiles from the utility network can be
drawn using the Draw Profile command which recognizes the utility
network data to use for labeling. The utility network models can be
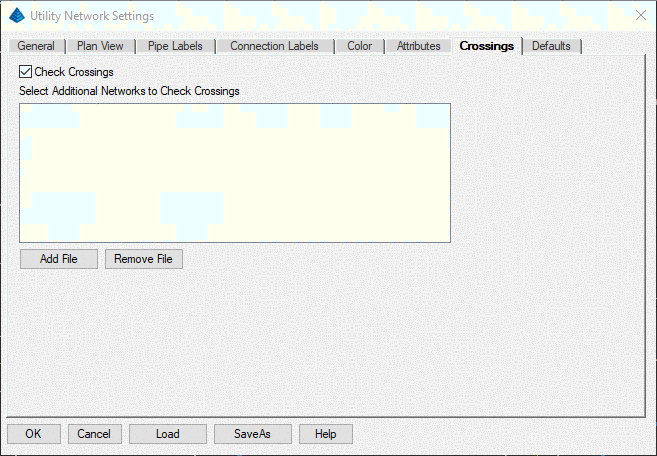
used in the Collisions Conflict Check command along with sewer
network models.
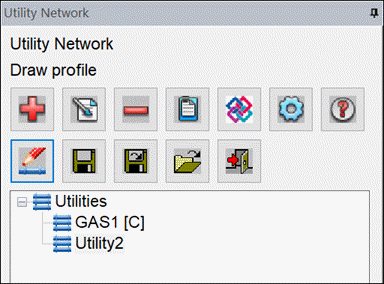
This command docks a dialog to the side of the drawing.
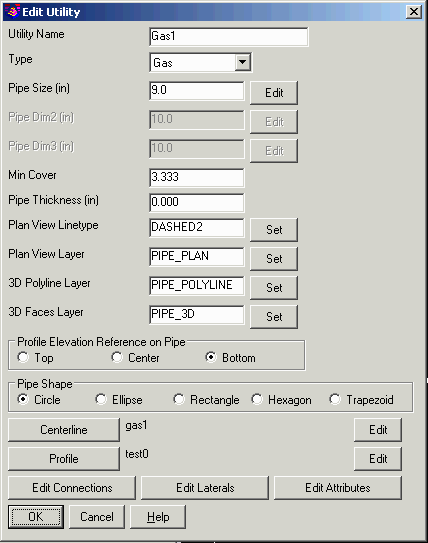
Both the Add button and Edit buttons lead to a dialog
to define a utility line.
The
Utility Name is simply the name of the utility line. Each
name must be unique in the utility network.
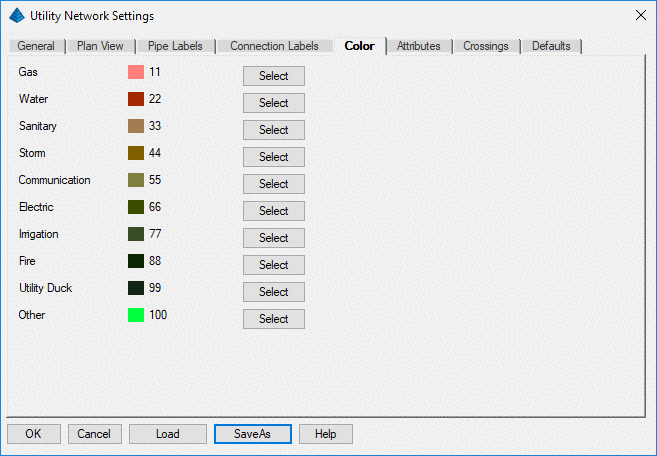
The Type setting chooses the type of utility as gas,
water, sanitary, storm, communication or other. The setting is used
in reporting and used to set the default color for the
linework.
The Pipe Size is the initial size for the utility line.
When the size changes, use the Edit button to set the size at
different stations along the line.
The Min Cover is the minimum depth for the utility
profile. This value is used to create the profile and keep it below
the reference surface. Also, the Report function has a report for
checking the min cover.
The Plan View Linetype is used for drawing the utility
line in the Draw Plan View function.
The Layer settings are used for drawing the utility line
in the drawing.
The Profile Elevation Reference On Pipe controls the pipe
position for the utility profile.
The Pipe Shape chooses the type of the utility
line.
The Centerline defines the horizontal alignment for the
utility line.
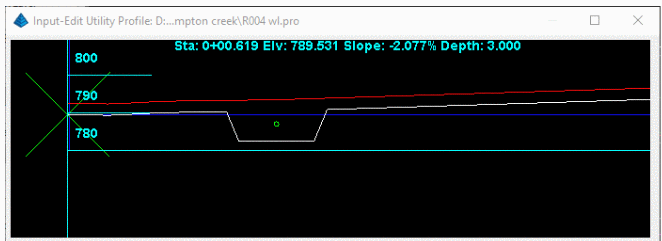
The Profile defines the vertical alignment for the
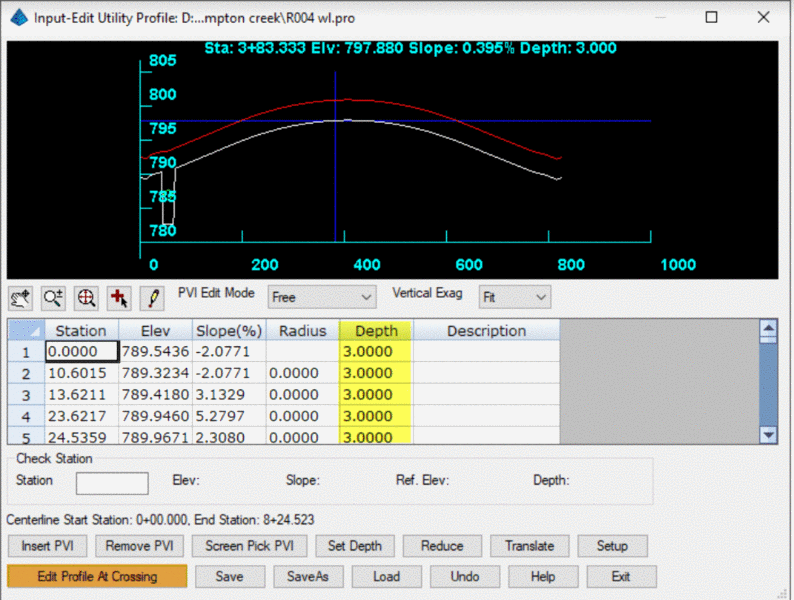
utility line. Pick the Edit button to bring up the Utility Profile
editor. This profile editor is similar to the Road Profile
Editor which is documented in the Roads chapter. This Utility
Profile editor has a couple special functions.
Set Depth can be used to make the utility profile a fixed
depth from the reference surface. This function has an option to
add stations in the utility profile at each grade break in the
surface so that the utility profile can exactly follow the
surface.
Reduce removes profile data points without changing the
profile elevations more than the specified cutoff tolerance.
Translate is used to change the elevation of a profile by
inputting a range of stations and the elevation value.
Setup calls the Road Profile Settings dialog box.
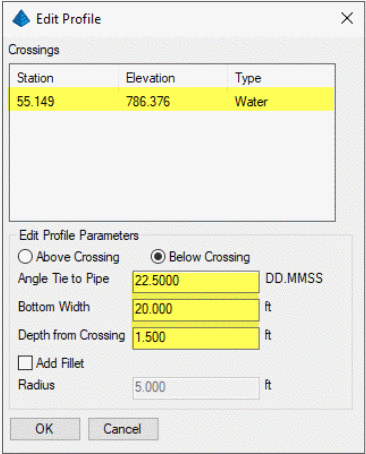
Edit Profile at Crossing allows for editing the profile when
it must pass over or under another utility and brings up the
Edit Profile dialog. Choose the Station to Edit.
Choose if the profile is to pass over or under the crossing.
Input the Angle Tie to Pipe to drop or rise. Input the
Bottom Width of the crossing excavation (flat after drop or
rise). Input the Depth From Crossing
(clearance)
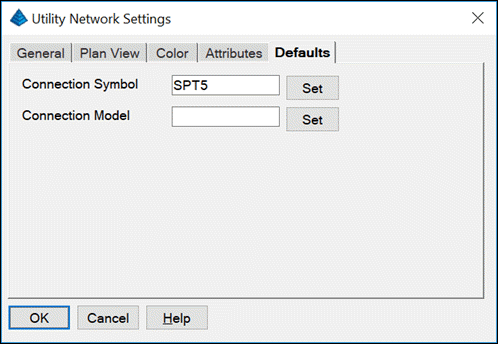
The Edit Connections is an optional list of stations along the utility line where you can set a name and symbol or model. The symbols are used to draw in plan and profile views. The Model is a 3D Solid such as a valve to draw with the Draw 3D Faces function.
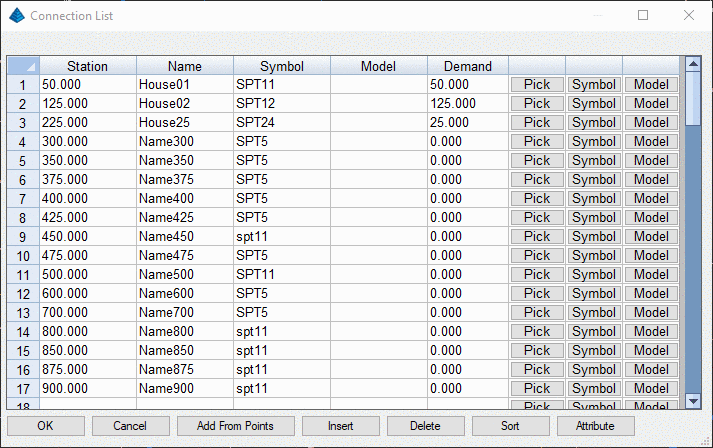
Add From Points allows the user to add connections by
importing coordinate file points by range or group.
For the Insert function, the program first prompts for
the centerline. You can either select an existing .CL file, or pick
a polyline from the drawing. When you select a 3D polyline, this
polyline is used both for the centerline and profile.
The Delete function removes the currently highlighted
utility line from the network.
The Report function has three type of reports. The Data
Files report includes the parameters for each utility line. The Min
Cover report checks each utility profile and reports stations below
the min cover as well as the average cover. The Quantities report
includes the utility name, type, length, shape, pipe size and
user-defined attributes.
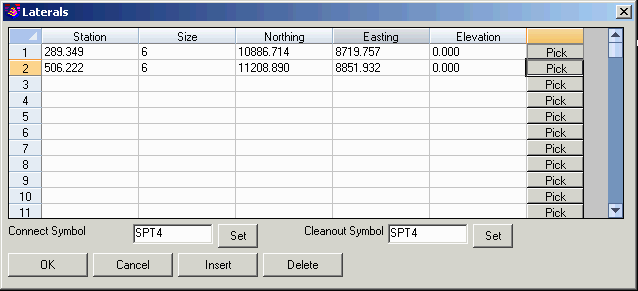
The Edit Laterals is an optional list of laterals from
the utility line. Each lateral is defined by a station at the
connection along the utility line, the pipe size for the lateral
and the cleanout coordinates. Use the Pick button to screen
pick the connection and cleanout points, or to pick an existing
line for the lateral. The Connection and Cleanout Symbols are used
with drawing the utility network in plan view.
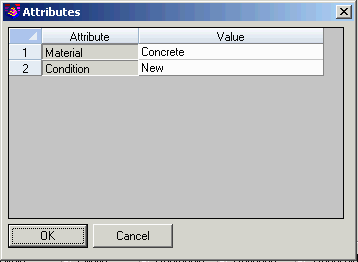
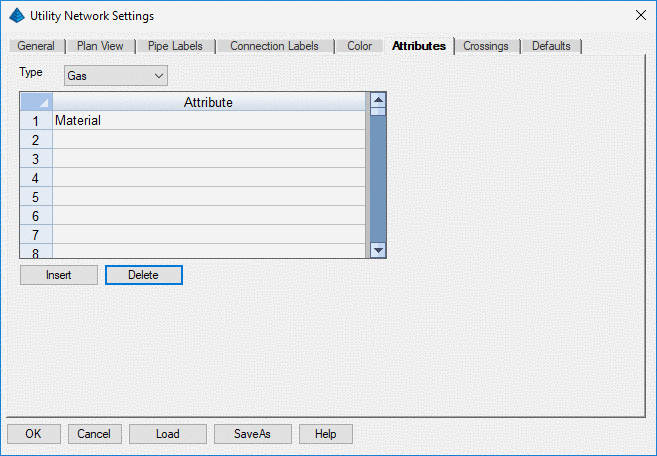
The Edit Attributes is an optional list of attribute names
and values such as pipe material to assign to the utility. The list
of available attributes are defined in the Settings function. These
attributes are used in reporting. The attribute values are entered
in a spreadsheet.
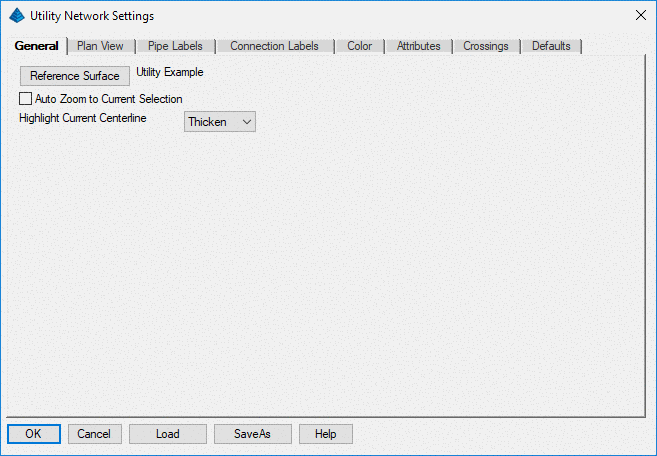
For the Settings function, the Reference Surface is a
triangulation file that is used for the min cover and as a
reference when editing the utility profile. The Auto Zoom To
Current Selection and Highlight Current Centerline apply
to highlighting utility names in the dialog list. When Auto Zoom is
on, the program will zoom the drawing to show the highlighted
utility line if it is not already visible in the current
view. Use Load to load an existing Utility Network
Settings file (.UNS). Use Save As to save the current
Utility Network Settings to a .UNS file for later use.
 The Draw button has four
functions:
The Draw button has four
functions:Pulldown Menu Location: Network
Keyboard Command: utilnet
Prerequisite: None