Fence Diagram
Fence Diagram produces a profile of the surface and strata along
the selected baseline polyline--a geological cross-section. Fence
diagrams are a good way to verify that the geological model is
correct-especially when the drillholes are plotted on them with
Draw Geologic Column command. The first step is to draw a baseline
polyline in plan view from which the fence diagram is created. This
polyline can have more than two points. There are three tabs on
this dialog, detailed below.
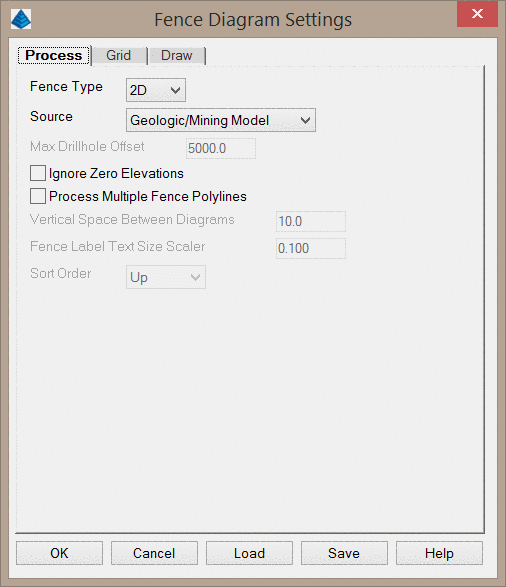
Process Settings
Fence Type: This option determines if the fence will be
drawn in 2D at a user-specified location, or in 3D in real world
coordinates.
Source: This option determines the source of the fence.
The Intersection method builds a model on-the-fly by
triangulating the drillholes and then finding the intersection of
the triangulation mesh and the fence polyline. In order to obtain
data for the strata with the intersection method, the polyline must
have at least one drillhole on each side. It is the only way to see
a fault in a fence diagram when using the drillholes.
The Grids from Drillholes option builds a model on-the-fly.
When this option is used, you will be prompted to select drillholes
to build the model, as well as your modeling parameters. This
option is only recommended for quick inspection of how the model
will appear, but it is not generally recommended as some geologic
modeling options cannot be applied with this method, such as
accounting for faults.
The Geologic/Mining Model option is the most common method,
as it pulls the geologic information from an existing Geologic or
Mining model file (.pre or .mmd). This is the recommended method
for drawing most fence diagrams.
Max Drillhole Offset: This option is only available when the
Source is set to the Grids from Drillholes option. This
values sets a search radius for drillholes. Any drillholes further
than this distance from the polyline will not be used for building
the geologic model.
Ignore Zero Elevations:
This option is only available when the Source is set to the
Grids from Drillholes option. When creating a surface topo
for the model, this option will disregard any entities at zero
elevation.
Process Multiple Fence
Polylines: This option allows you to draw multiple fence
diagrams at the same time. Instead of picking a single fence
alignment polyline, you can select multiple polylines that have
been tagged using the Tag Fence Polylines command. Each of the
fence diagrams will be labeled accordingly.
Vertical Spacer Between
Diagrams: This value controls the spacing between fence
diagrams when more than one are drawn at a time. This value is
multiplied by the Horizontal Scale and the Fence Label Text Size
Scaler to determine the true drawing distance between the
diagrams.
Fence Label Text Size Scaler: This value controls the size
of the fence labels when drawing more than one at a time (that is,
the labels identifying Fence 1, Fence 2, etc.). This value
multiplied by the Horizontal Scale sets the actual text size for
the labels.
Sort Order: This option determines if the fences will be
stacked upwards or downwards when more than one are drawn at a
time.
Grid Settings
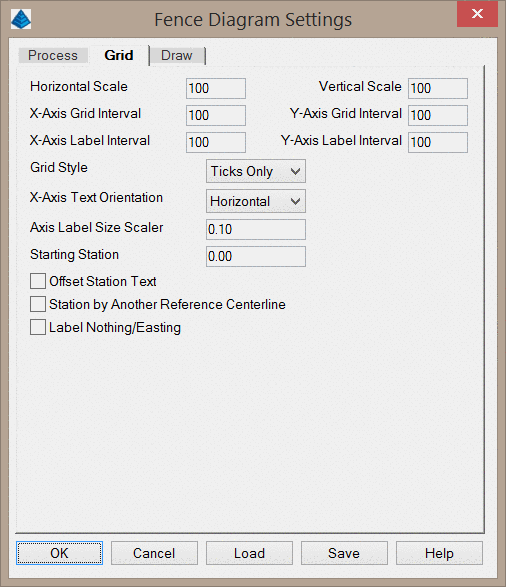
Horizontal
Scale: This value sets
the overall drawing scale that many other options in the dialog
reference for scaling. This allows you to quickly change the size
the geologic columns with a single value.
Vertical Scale:
This value, relative to the
Horizontal Scale, determines the vertical exaggeration. For
example, a Horizontal Scale of 50 and a Vertical Scale of 10 will
produce a 5X vertical exaggeration.
X/Y-Axis Grid Interval:
This value
sets the grid line
spacing for the X and Y axes. For example, a Y-Axis Grid Interval
of 25 will draw a tick/grid line every 25 ft/m of elevation
change.
X/Y-Axis Label Interval:
This value sets the text
intervals for the X and Y axes. For example, a Y-Axis Label
Interval of 100 will draw an elevation/depth label every 100 ft/m
of elevation change.
Grid Style: This option
controls how the grid will be drawn.
The Grid Lines option will draw a true grid with lines
spanning the appropriate axes.
The Ticks Only option will draw the grid axes, but instead
of full lines spanning the axes, small tick marks will be placed
along each axis.
X-Axis Text Orientation: This option controls the rotation
of the stationing labels on the X-axis.
Axis Label Size Scaler:
This value, relative to the
Horizontal Scale, determines the text height of the
elevation/depth/stationing labels. For example, an Axis Text Size
Scaler of 0.15 and a Horizontal Scale of 100 will produce text
labels with a height of 15 drawing units.
Starting Station: This is the station
that is labeled at the beginning of the fence diagram horizontal
X-axis grid. By default it is set to 0.
Offset Station Text:
Offsets the station labels below the horizontal axis of the
grid.
Station By Another Reference Centerline: This option will
station the horizontal X-axis by a predefined centerline CL file.
The centerline file will be prompted for after clicking OK.
Label Northing/Easting:
This option labels the Northing and Easting coordinates along the
bottom of the fence diagram at every vertex on the fence line that
is drawn in plan view. An example is shown below.
Draw Settings
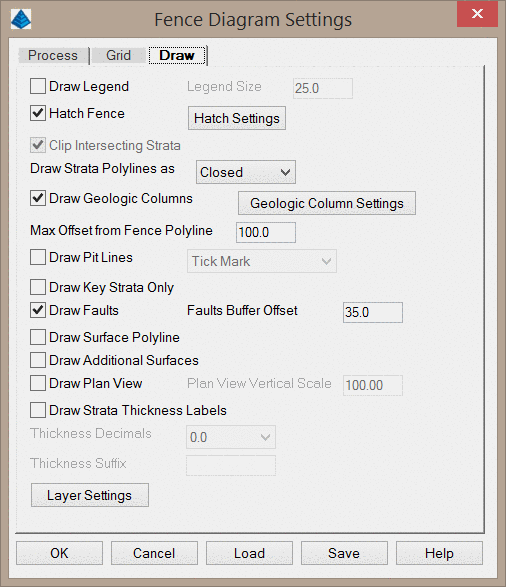
Draw Legend: This option
draws a legend of the strata hatch patterns and colors. You will be
prompted to pick the location for the legend after clicking
OK.
Legend Size: This values
sets the size of the legend.
Hatch Fence: This
option will hatch in the strata layers in the fence. If this option
is disabled, only polylines will be drawn. The strata hatch
patterns are defined in the Define Strata command. If a strata
exists that is not defined, it will use a default hatch
pattern.
Hatch Settings: This
button will display the below dialog.
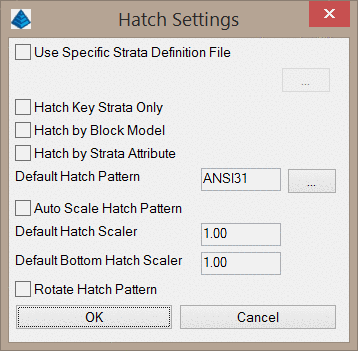
Use Specific Strata
Definition File: This
option will draw the strata hatch patterns using a strata
definition file other than the current strata definition file. When
enabled, you can select the strata definition file by clicking the
ellipsis button.
Hatch Key Strata
Only: This option will just hatch Key strata that are
drawn. The Non-Key strata will be left as polylines with no hatch
inside. Shown here is an example that has just the Key strata
hatched.
Hatch by Block Model: This
option will hatch the seams using a Grade Parameter File. This
option requires a block model to be stored in the Geologic Model to
define the quality of the strata. An example is shown below.
Hatch by Strata Attribute:
This option is similar to Hatch by Block Model, except there is no
Grade Parameter File required. It will look at look at the quality
attributes found in the Geologic Model, or in the drillholes, and
bring up a list. You will be able to select an attribute to hatch
by, and then a color palette will appear, allowing you to specify
the colors and ranges for the quality zones. This will just change
the hatch horizontally across the strata, not vertically as the
Block Model does. Shown below is an example of coal seams colored
by BTU.

Default Hatch Pattern: This option sets
the hatch pattern for strata layers that are not defined in the
Strata Definition file.
Default Hatch Scaler: This value sets the hatch pattern
scale for default hatch patterns. The scale of the hatch pattern
will equal this value multiplied by the Horizontal Scale.
Bottom Hatch Scaler: This
value sets the hatch pattern scale for the portion of the fence
diagram below the last strata layer. The scale of the hatch pattern
will equal this value multiplied by the Horizontal Scale.
Rotate Hatch Pattern: This option
rotates hatch patterns to best fit the angle of the strata. A hatch
pattern can have only one rotation, so rotating will not be
effective for a strata with multiple rotations. Rather than use
this automated method for setting the hatch rotation, the rotation
for each hatch can also be set in the Strata Definition
file.
Clip Intersecting Strata:
This option will automatically clip strata layers that cross one
another, with the upper grids clipping out the lower grids. This
will display the strata layers as they will be interpreted for
volume calculations. If this option is disabled, the strata layers
will not clip one another. The below image shows two strata layers
that clip one another. Note that this option cannot be used when
hatch patterns are used.
Draw Strata Polylines as: This option determines if the
strata layers are drawn as closed polylines, or as single, open
polylines. It is recommended to use the Single option when
drawing cross sections for use with the Range Diagram commands in
the Surface Mining module.
Draw Geologic Columns: This option will draw the drillholes
on the Fence Diagram. When this option is enabled, you can click
the Geologic Column Settings button to show settings associated
with drawing the drillholes. These are the same settings included
in the Draw Geologic Column command.
Max Offset from Fence
Polyline: This option sets the search distance from the
fence alignment polyline. Any drillholes beyond this distance will
not be drawn on the fence diagram.
Draw Pit Lines: When this
option is enabled, the program will prompt you to select pit
polylines. These pit polylines will be labeled with a vertical line
and labeled along the bottom of the fence diagram grid at the
position where the fence plan view polyline crosses the pit
polylines. This option is useful for dragline design commands such
as Cut and Place. The dropdown list to the right of this option
controls if the vertical line is set to a fixed height (Tick Mark
option), or if the vertical line extends from the grid bottom to
the bottom strata (To Bottom Strata option).
Draw Key Strata Only: This option will
only draw the Key strata on the fence diagram. The Non-Key
intervals found in between the Key will be drawn, but not be
labeled individually.
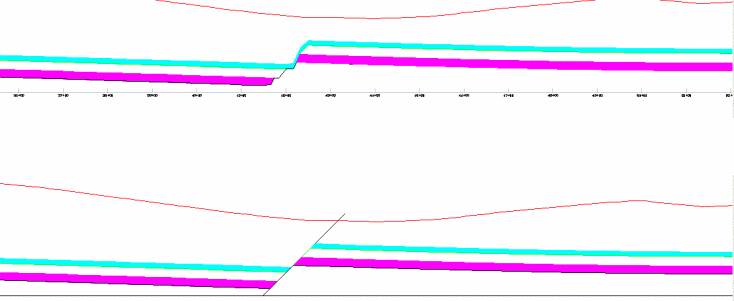
Draw Faults: This option will draw the fault line in the
location and at the angle that it crosses the cross section.
Although grid files may be modeled with a fault, this option
ensures that the representation of the fault is sharp. The below
image shows a fence diagram without this option (above) and with
this option (below). The program uses the Faults Buffer
Offset value to clip the strata. The fault line will be offset
by this amount and the strata within the offset will be redrawn to
remove the noise of the grid behavior near the fault. It is
recommended to set the Faults Buffer Offset value to be at least
1.5 times the strata grid cell size.
Draw Surface Polyline: This
option will draw a new polyline along the surface of the fence
diagram. This is particularly helpful for show the true surface
topography when there are outcrops, as this new polyline is
guaranteed to run along the full length of the cross section. This
is necessary for the Range Diagram commands found in the surface
Mining module.
Draw Additional Surfaces:
This setting will allow you to show additional surface files on the
cross section that are not part of the geologic model. A prime
example is the water table, which may traverse multiple strata
types. When this option is used, you will be prompted to select the
surfaces to draw after clicking OK.
Draw Plan View: This option will graph the drillhole
locations above the fence diagram. For this graph, each drillhole
is projected onto the baseline polyline to find the station and
offset of the drillhole.
Plan View Vertical Scale: This value sets the scale factor
for the Plan View drawn above the fence diagram.
Label Strata Thickness: This option adds a label for the strata
thickness along the fence. When this option is used you may specify
the number of decimals to display with the Thickness
Decimals dropdown list, and you may also add a suffix to the
labels with the Thickness Suffix text box.
Layer Settings: This button displays the below dialog to set
the layers for the different portions of the diagram.
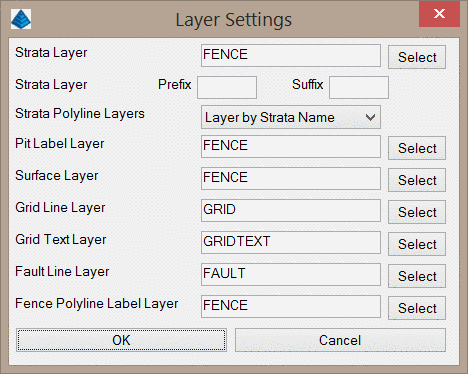
Strata Layer: This value sets the layer the area
of the diagram below the last strata layer (the portion of the
cross section that has not been modeled as part of the geology).
You may also set a Prefix and Suffix for this layer
name.
Strata Polyline Layers: This option controls the layering
for the strata polylines.
The Layer by Strata Name option will put each strata on a
separate layer as defined in the strata definition file. If a
strata definition file is not used, the layer for each strata will
simply be the name of the strata.
The All on Same Layer option will put all strata polylines
on the same layer, defined by the Strata Layer option.
The Non-Key on Same Layer option will place all of the
Non-key strata on the same layer, while the Key strata will be
placed on their own layers.
Pit Label Layer: This option controls the layer for the Pit
Labels that are drawn as a result of the Draw Pit Lines
option.
Surface Layer: This option controls the layer of the surface
polyline that is drawn as a result of the Draw Surface
Polyline option.
Grid Line/Text Layer: These options control the layers of
the grid lines and grid labels.
Fault Line Layer: This option controls the layer of the
fault polyline drawn as a result of the Draw Faults
option.
Fence Polyline Label Layer: This option controls the layer
of the labels for the fence name when multiple fences are drawn at
once (e.g. Fence 1, Fence 2, etc.)
Prompts
Fence Diagram Settings dialog box
Select polyline to pull fence diagram from: pick the
polyline
Select surface entities & at least 3 drillholes.
Select objects: Select the drillhole symbols and surface
entities. Surface entities can include points, lines, and
polylines.
Reading points ... 139
Reading drillholes ...
Choose modeling method (<Triangulation>/Inverse
dist/Kriging/Polynomial/LeastSq)? Press Enter
Bottom elevation of grid <1600.00>: press Enter to accept default
Top elevation of grid <2000.00>: press Enter to accept default
Pick the lower left corner for the fence diagram: pick a
point in a clear area of the drawing
Pulldown Menu Location: StrataCalc
Keyboard Command: fence
Prerequisite: Drillholes or Geologic Model, and a fence
alignment polyline