Calculate Variogram
This command takes the selected drillholes and calculates the
variogram data, outputting the Nugget, Sill and Range. These
parameters are entered into the Carlson Kriging dialogs for
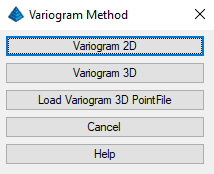
gridding and block modeling. Variograms may be 2D or 3D. When the
command is first activated, you will be prompted to select the
variogram type, as shown below. Selecting Load Variogram3D
point file will skip the drilhole, Strata/Bed, and attribute
selection steps, and load a "DAT" point file directly and go into
the 3D variogram dialogue.
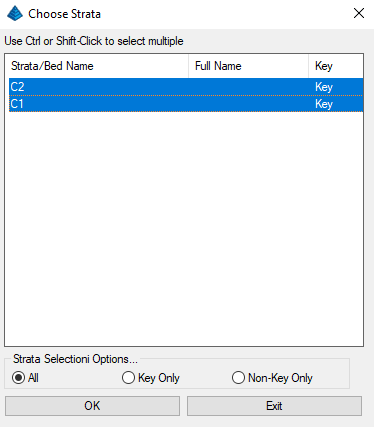
After selecting the variogram type, you will be prompted to
select the drillholes, channel samples, and strata polylines to use
for variogram calculation. You will then be prompted to select a
strata to process, as shown below.
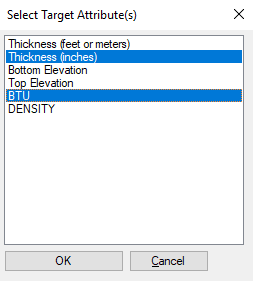
After selecting the strata to process, you will
be prompted to select a value or values to process, as shown
below.
2D Variogram
The 2D variogram window is shown below.
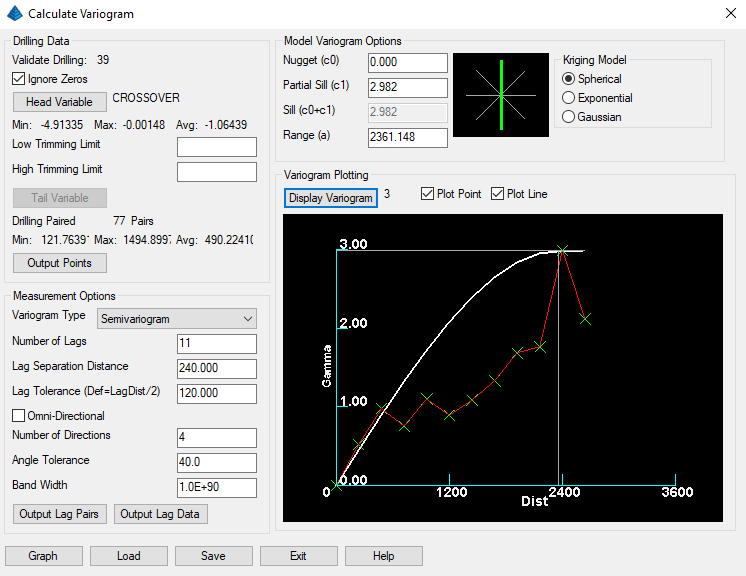
Drilling Data:
This section covers the base data points and attributes which
are being used in the analysis.
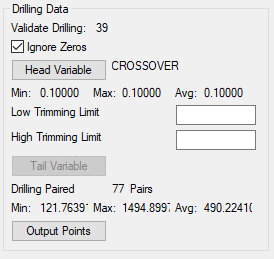
- Head Variable: Lists the variable that is analyzed.
- Tail Variable: Lists secondary the variable that is
analyzed for Cross Semivariogram and Correlogram.
- Ignore Zeros: Ignores any zero values in the
drilling.
- Validate Drilling: Lists the number of holes
used.
- Min/Max/Average: Lists the minimum, maximum and average
values of the sample points.
- Low and High Trimming Limit: Trimming limits will
provide a range selection to process. A value of 0 trimming will
delete null values.
- Drilling Paired Dist.: This shows the number of found
pairs in the drillholes.
- Min/Max/Avg: This is the distance between all sampled
pairs of drillholes.
- Output Points: Outputs a ".csv" file of the points in
the analysis for verification and further analysis..
Measurement Options:
This bottom left section of the dialogue covers the several
options for the measured variogram

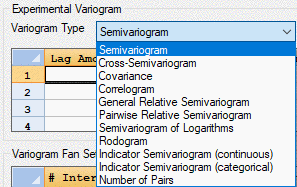
The type of Variogram Type button is a dropdown with the
following options.
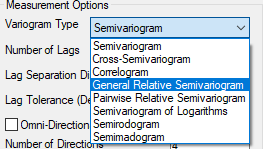
- Semivariogram
- Cross Semivariogram
- Correlogram
- General Relative Semivariogram
- Parwise Relative Semivariogram
- Semivariogram of Logarithms
- Semirodogram
- Seminadogram
The Cross Semivariogram and Correlogram calculate
the relationship between two different attribute types and
distance. To calculate them a tail variable will have to be
selected.
Variogram Measurement
Attributes:
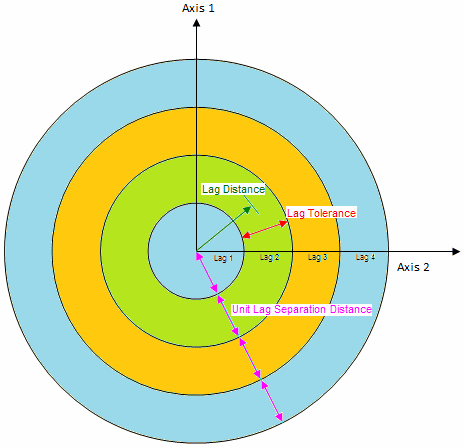
- Number of Lags: Set the number of lags, or pairs to
model.
- Lag Separation Distance: Distance between the pairs. The
distance between the lags should be set to the minimum drilling
paired distance.
- Lag Tolerance: Lag Tolerance is Lag Separation Distance
divided by 2.
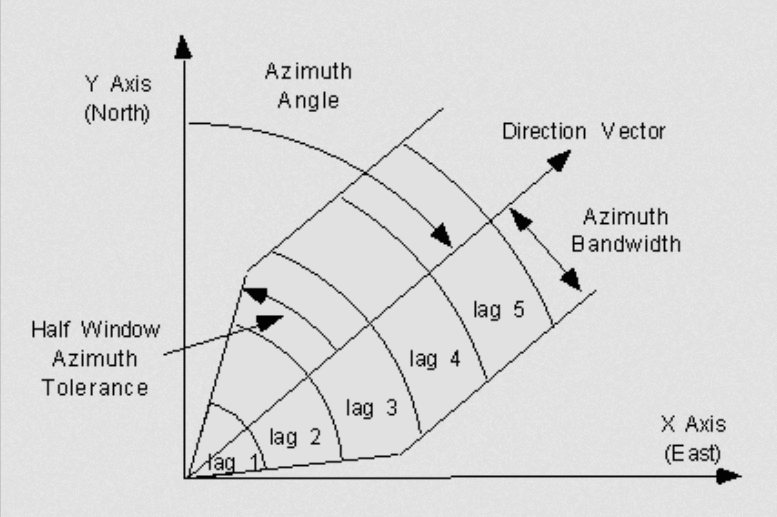
- Omni-Directional: Omni-Directional will look in multiple
circular groups for pairs. If it is off, then it will look just
directional for the pairs.
- Number of Directions: Directions it will look for
pairs
- Angle Tolerance: angle to stay under for looking for
pairs.
- Band Width: How wide to look for the pairs.
- Output Lag Pairs:
- Load/Save: Saves the variogram data as a VIO file that
can be loaded later.
Pressing Graph will show the plot as a red line and the points as
green X. They can be turned on or off to display in the window. The
curve must then be fit to the red line manually with left mouse by
double clicking to locate the values.
Fitting:
Omni-Directional: Click Exponential option beside big circle on the
right to begin. Left click left mouse and drag on the plot to set
Range, Sill and Nugget or enter them in the boxes to update the
curve. To move the Nugget, left click on the far left side, at the
beginning of the curve.
Directional Trend: The variogram plots redraw by clicking on the
lines on the large directional window at the top, with the green
line, so the 4 angles would be: 0 Azimuth, 135 Azimuth, 90 azimuth
and 45 azimuth. The resulting values are displayed above for
geostatistical modeling.
The nugget, sill and range are labeled here, for a spherical
model:

3D Kriging
The 3D variogram is shown below. It calculates a 3D
ellipsoid of anisotropy which is used in 3d Kriging by following
the steps in "Ellipsoid Finder Instructions Tab".
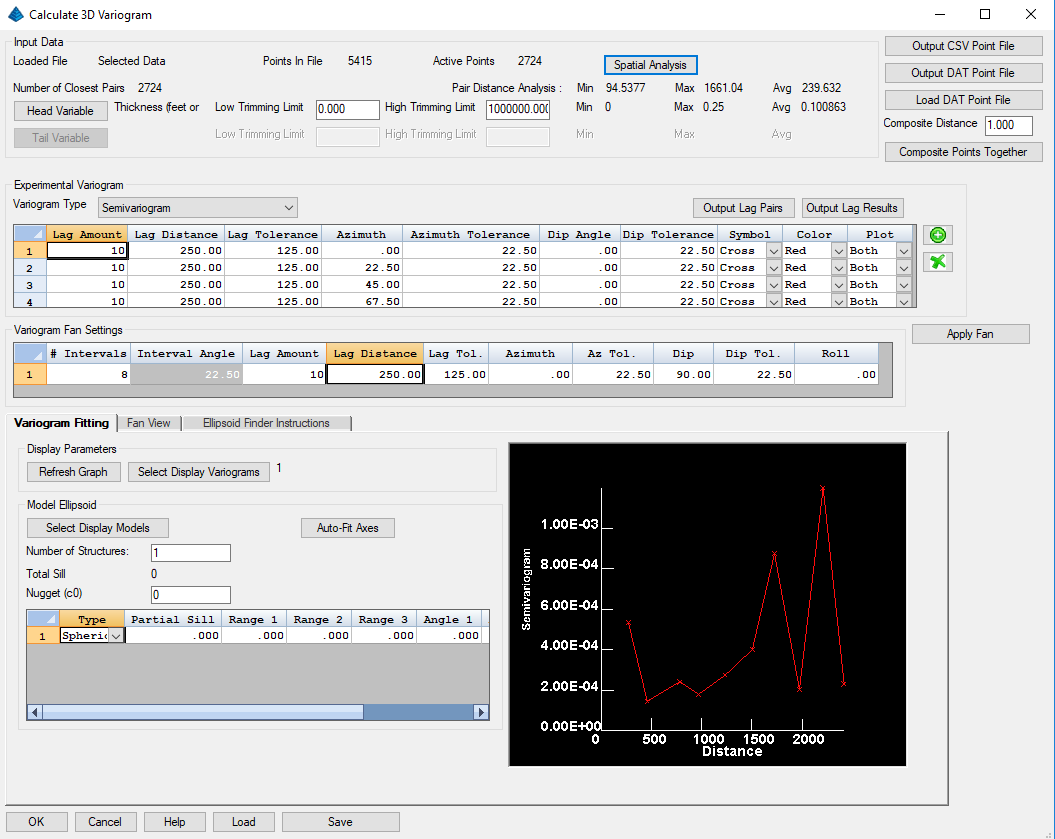
Input Data:
This section of the dialog deals with the input data, summarizing,
and manipulating it.
- Loaded File: Informs user the file which has been loaded
or whether using the selected data from CAD.
- Points in File: The number of data points in the
file. Each point does not hold all of the selected
attributes.
- Active Points: The number of data points which have both
the head and tail variable.
- Closest Pairs: Gives data on each points closest
neighbor. This information helps select the lag distance and
decide whether compositing is necessary
- Spatial Analysis: This button will scan the sample data and
generate summary values which are used to selected values for the
Experimental Variogram.
- Low Trimming Limit: This value sets the minimum
attribute value to consider for the variogram.
- Maximum Trimming Limit: This value sets the maximum
attribute value to consider for the variogram.
- Head Variable: This is the active value for all
variogram types, and it can be changed
- Tail Variable: This second variable used in Correlogram
and Cross Semivariogram analysis
The following items are utility for saving, loading, and
manipulating the input data points
- Output CSV Point File: Gives data on each points closest
neighbor. This information helps select the lag distance and
decide whether compositing is necessary
- Output DAT Point File: This button will scan the sample data
and generate summary values which are used to selected values for
the Experimental Variogram.
- Load DAT Point File: This will load a dat file into the
model. Useful for saving work from point compositing.
Only selected Head and Tail variables will be saved
- Composite Distance:The distance which points should be
combined together. When compositing points values are
averaged together. Compositing is done by selecting
"Composite points Together" button.
Experimental
Variogram:
This section deals with specifying the settings which to measure
directional variograms and how they should be
displayed.
- Variogram Type: The Variogram types include all of the
options of 2D as well as including a plot of the number of
pairs. This isn't a variogram type, but instead a shows the
number of pairs used to determine the value of each lag, which
makes validating data easier.
- Output Lag Pairs: This will output a csv file with a
list of each lag pair and their associated directional variogram
information and the data values.
- Output Lag Results: This will output a csv file with the
resulting values for each lag bin which can be used to store the
results of past experiments.
- Variogram Table: Each row represents a measured
variogram with controllable direction and direction measurement
tolerances. How each variogram is displayed can also be
controlled with Symbol, Color, and Plot options.
Variogram Fan
Settings:
This section deals with laying out a set of variograms in a
plane. The Azimuth and Dip define the first direction of the
plane normal and the roll describes the spin of the variogram
fan. It is suggested to try apply the fan with Azimuth at 0,
Dip at 90, and Roll at 0 and then vary the Roll values to see the
changes in experimental variograms.
Model Ellipsoid items deal with fitting a model variogram, and
the three directional variograms needed for a 3d
Kriging.
Experimental Variograms are not automatically updated for each
change in the Variogram Fan Settings. This can allow for
custom settings per Experimental Variogram. Select "Apply
Fan" to apply to create a set of Experimental Variograms according
the the Variogram Fan settings.
The Variogram Fan Settings and Experimental variogram directions
are automatically set during the Ellipsoid finder steps, so no
further adjustments beyond lag distance settings or direction
interval are recommended.
Variogram Fitting:
This section deals with displaying the results of Experimental
Variograms and creating the model variograms which are used by 3D
Kriging.
The display parameters can refresh for the graph to show
adjustments in experimental variogram and adjust which experimental
variograms are being displayed.
The Model ellipsoid section deals with setting the values of the
modeled variogram and each item is described below
- Select Display Models: Specify which or none of the
model variograms are being displayed, only Experimental Variograms
1, 2, 3 can be modeled and they are associated with the Major,
Minor, and Intermediate Axis of Anisotropy respectively
- Auto Fit Axes: This will automatically set the nugget,
sill and and ranges for all 3 axes according to a single structure
model. This uses a max variography point fitting technique,
final judgement and adjustment according to statistical judgement
is recommended.
- Number of Structures: The number of unique variography
regions. Each structure is associated with one row of the
Model Ellipsoid table
- Total Sill: The sum total of each structure's sill and
the nugget effect
- Nugget Effect: The expected variation at zero
distance, a stand in for the inherent variation of the rock
mass
- Range: The distance at which the model variogram reaches
the specified sill value
- Angle: These describe the orientation of the Model
Ellipsoid. Angle 1 describes the Azimuth, Angle 2 describes
the dip, and Angle3 describes the roll. These values do not
affect the plot of the model ellipsoid, but the Kriging
analysis. It is not suggest to change them once set by the
Ellipsoid Finder
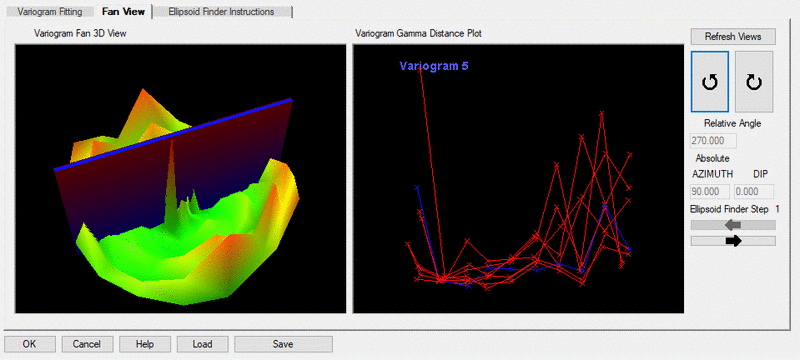
Fan View:
This section deals with visualizing the variography in 3D and 2D
plot forms to assist in the selection of minimum or maximum
directional variance. Following the steps
Fan View:
This section deals with visualizing the variography and selecting
the minimum or maximum directional variance for the Ellipsoid
Finder. The Variogram Fan 3D view shows the variography in
the z axis, along the variogram fan the X, Y axis. The
adjustable plane is the indicator of the selected direction.
The "Variogram Gamma Distance Plot" is the same plot which is in
Variogram Fitting but with all of the variograms showing. The
selected variogram is labeled and shown in blue.
Selecting the rotational arrows switches the target Experimental
variogram. Selecting the left right arrows applies the
selected variogram direction, updates the Variogram Fan and
Experimental Variograms.
Ellipsoid Finder
Instructions:
This section gives instructions and tips on calculating the
Ellipsoid of Anisotropy. Selecting the left right arrows
applies the selected variogram direction. The prompted
minimum and maximum directions of variance must be selected in the
"Fan View" tab. Once all the directions are found the Sill
and Range values must be selected in the "Variogram Fitting"
tab. Selecting the "Save" button will save the Modeled
ellipsoid of anisotropy and "Load" will bring back previously
saved
Pulldown Menu Location:
StrataCalc
Keyboard Command:
vgramrun