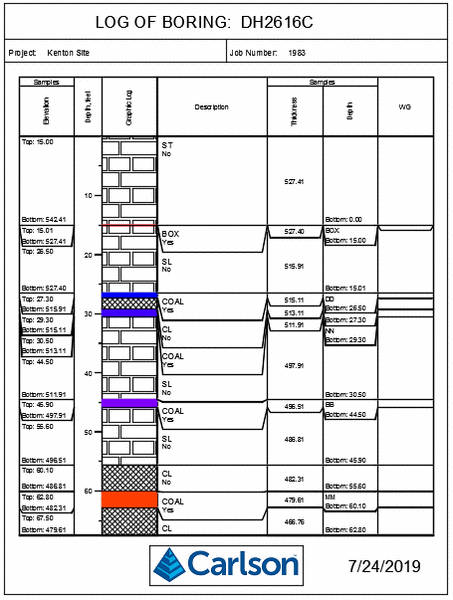
Graphic Drillhole Report
This command creates a graphic drillhole log of the selected
drillholes. It displays drillhole data such as depth, thickness,
geological hatch patterns, and any attributes in the drillhole. An
example report is shown below.
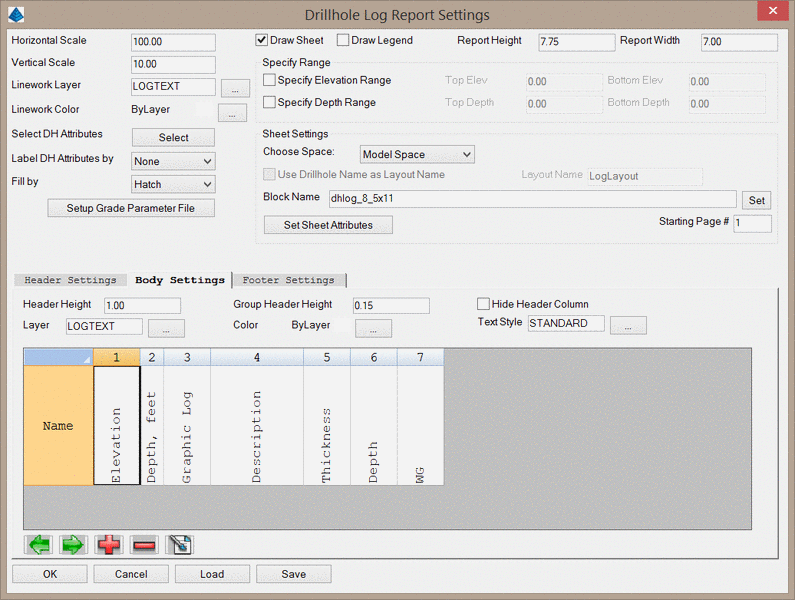
- Horizontal Scale: Sets the scale of the drawing. This
usually matches the Horizontal Scale found in Drawing Setup, but
not always.
- Vertical Scale: Controls the vertical exaggeration of
the plot. If this value is less than the Horizontal Scale, then it
will be vertically exaggerated. For example H100:V50 will be a 2:1,
or 2X vertical exaggeration.
- Linework Layer: This setting controls the layer that the
linework is drawn for the boundaries, rows and columns.
- Linework Color: This sets the color of the
linework.
- Select DH Attributes: CHECK THIS
LATER
- Label DH Attributes by: CHECK THIS
LATER
- Fill By: This controls how to draw the strata in the
graphics log. The graphic log can be filled with a hatch pattern, a
solid fill, or can simply show the outline of the drill
sample.
- Label Water Level: This option
draws a triangle symbol at the water level in the depth scale bar.
The value for the water level comes from the drillhole attribute
using the specified attribute name. This value can be either a
depth or elevation.
- Setup Grade Parameter File: This option uses a Grade
Parameter File (.GPF) for the report. You can choose to color the
graphic log or the data labels by the grade colors. There is also
an option to label the grade name in the description
field.
- Draw Sheet: This option draws the entire sheet for the
report, including the title, project. Turning it off will turn off
the Sheet Settings section, and it will just draw the main rows and
columns of the log in the drawing.
- Draw Legend: This option draws a legend of the strata
names and hatch patterns.
- Report Height/Width: These parameters set the overall
dimensions of the report. For use with the provided 8.5x11 sheet,
these values should be set to 7.75 and 7.00, respectively.
- Specify Elevation/Depth Range: These options allow you
to report only a portion of the drillhole, based on a range of
elevations or depths. If both of these options are disabled, the
entire drillhole will be reported.
- Choose Space: There are 3 options for drawing this
report. Paper Space, Model Space and PDF. Paper Space will create a
new Layout tab, using the name in the Layout Name window. Model
Space will draw the plot in the working drawing, where picked. PDF
will write the report out to its own PDF file.
- Use Drillhole Name as Layout Name: When using the Paper
Space option, this option will use the drillhole name for the names
of the Layout Tabs.
- Layout Name: When using the Paper Space option, this
sets the name of the new Layout Tabs.
- Block Name/Set: This window sets the dwg drawing block
of the sheet to use for the report. A template called called
dhlog_8_5x11.dwg is provided in the directory
C:\Users\USERNAME\AppData\Roaming\Carlson
Software\Carlson20XX\XX\SUP. This can be edited to customize how
the block will appear in the report, with company logos, legends,
etc.
- Starting Page: This sets the starting page of the
reports for inclusion into existing documents.
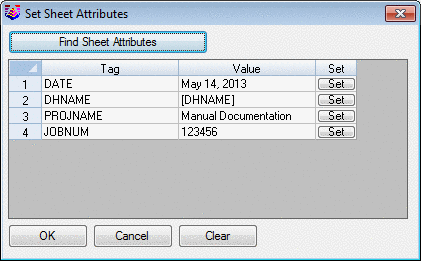
- Set Sheet Attributes: This sets the topics for the
header data in the report. For custom reports, set the project name
and job number here. These are read from the Project and Job Number
in the Drawing Setup command. They can also be overwritten here
with a custom name. The Find Sheet Attributes searches the holes to
populate this list of available items, such as Drillhole
Attributes. To add custom drillhole attributes, an Attribute
definition must be added to the sheet template. The tag of the
Attribute Definition must match the tag shown in the below dialog.
Once the Attribute Definition has been added, you may use this
dialog to match the tag to a Drillhole Attribute. For example, you
may add an Attribute Definition of "TD" to the sheet, which ties to
the "Total Depth" Drillhole Attribute. To simplify this process, it
is recommended to start with the provided dhlog_8_5x11.dwg file,
copy and rename Attribute Definitions as desired, then saving the
sheet template to a new file. Alternatively, Drillhole Attributes
may be added to the report using the Header/Footer Settings,
discussed below.
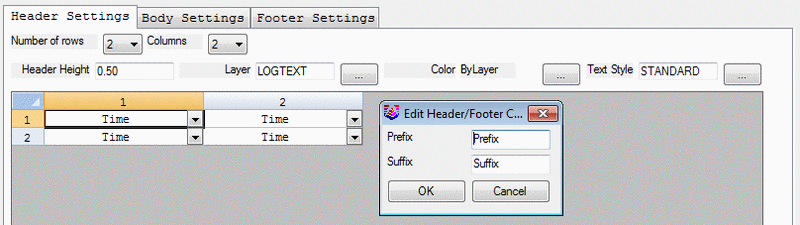
- Header/Footer Settings: These options prepare the Header
format for the report. To add rows and columns, use the Number of
rows and Columns pulldowns to set them. Then for each cell, drop
them down to choose the field to display in the header. To set a
Prefix or Suffix, choose the appropriate cell and choose the Cell
Settings button.
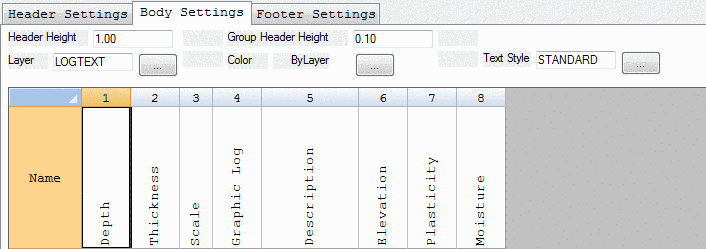
- Body Settings: These options control how the main body
of the report will appear. Rows and columns, header and group
heights are set here.
- Header Height: This value sets the height of the header
label. For longer header names, this value should be increased to
ensure the labels do not overlap the borders.
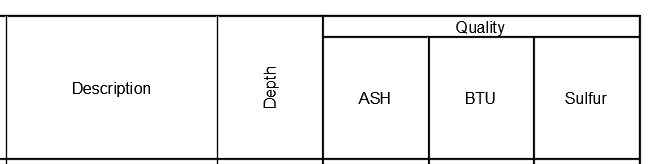
- Group Header Height: This values set the height of the
Group Header name. Each column name can be assigned a Group Header
name. When two adjacent columns share the same Group Header name,
an additional label will be added to the Header name. In the below
example, the Ash, BTU, and Sulfur all share a Group Header Name of
"Quality".
- Hide Header Column: When enabled, the gridlines for the
column headers will not be drawn.
- Layer: This sets the layer for the report.
- Color: This sets the color of the report.
- Text Style: This sets the text style for the
report.
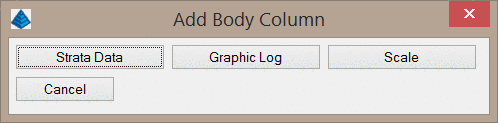
- Icons: The arrow/plus/minus icons can be used to
reorganize the order of the columns, or to add and remove columns.
The pen-and-paper icon allows you to edit column properties.
When a new column is added, the below dialog will appear. This
allows you to add either Strata Date (thicknesses, qualities,
etc.), a graphic log (visual representation of the drillhole), or a
scale (to show elevation or depth).
When Strata Data is selected, the below dialog will appear. Here
you can add Header Names, Group Header Names, and the Fields to be
included in the report. To add fields, move items from the
available fields on the left to the right, under selected fields.
the green arrows move them in all four directions. The middle, Edit
button allows for editing the Selected Field. This is where the
text size for the data in the columns is set, as well as the
centering in the fields.
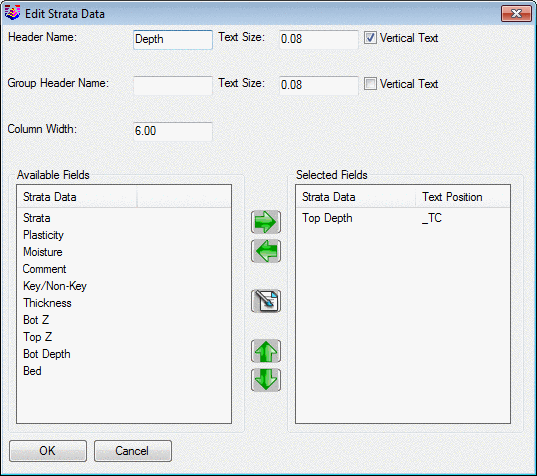
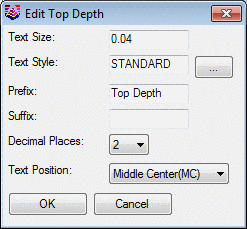
The middle Edit button allows for editing the
Selected Field. This is where the text size for the data in the
columns is set, along with the positioning, decimal places,
etc.
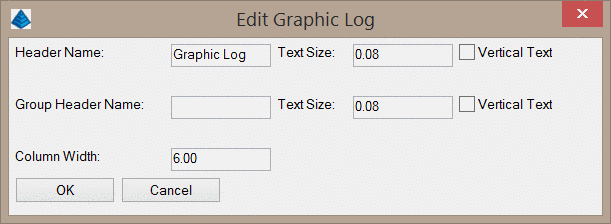
When a Graphic Scale is added, the below dialog
will appear. This is similar to adding Strata Data, but fewer
settings are available.
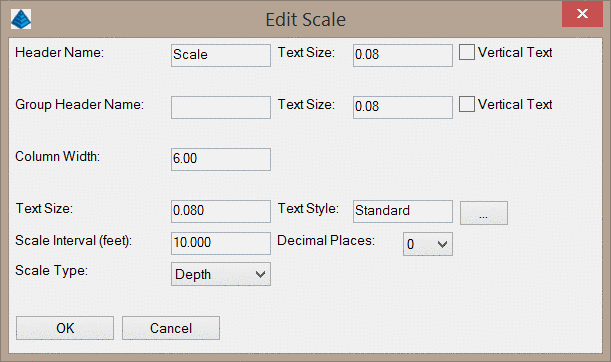
When a Scale is added, the below dialog will appear. Here you can
specify the interval of the scale, the scale type, etc.
After all of the settings are defined, hitting OK will prompt
for the location to draw the report. Based on the Choose Space
setting, it will either go to Model Space, Paper Space Layout, or a
PDF file.
Prompts
Select drillholes to report
Select objects: pick the drillholes
Pulldown Menu Location: Drillhole > Reports
Keyboard Command: chreport5
Prerequisite: Drillholes