Contour from Grid File
This command creates contours from a grid file. Contouring from
a grid employs a different method than from a triangulation network
and generally produces contours that loop more. The grid has data
points at a regular interval while the triangulation has edges for
every point and breakline in the surface. The smoothness of the
contours depends a great deal upon the grid resolution. When the
command is executed, you will be prompted to select
inclusion/exclusion perimeter polylines to limit the contours to
certain areas. If no perimeter polylines are selected, the entire
grid will be contoured. After selecting a grid file to contour, the
below dialog will appear.
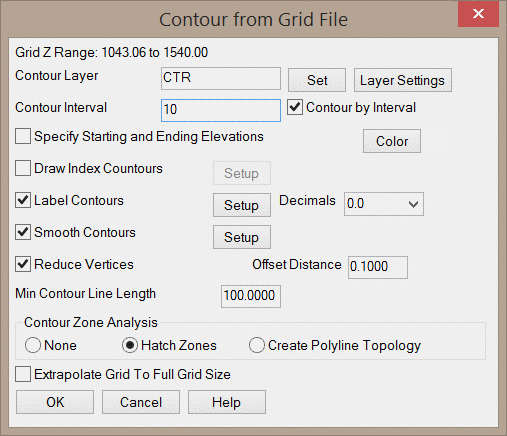
Grid Z Range: This text displays the current range of Z
values in the grid file to help you determine the optimal Contour
Interval/Values.
Contour Layer: This sets the layer for the contours. You may
select an existing layer by clicking the Set button.
Layer Settings: This button will open the below dialog,
which controls default naming for layers of the various
linework.
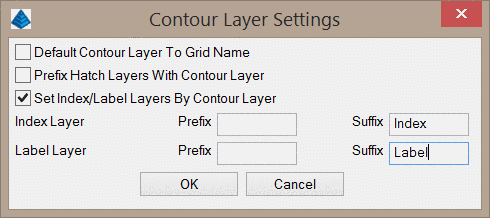
Default Contour Layer To Grid Name: When
enabled, this toggle will automatically set the Contour
Layer to match the grid name. For example, a grid named
"Topo.grd" would default to draw contours on the "Topo" layer.
Prefix Hatch Layers With Contour Layer: When enabled, this
toggle will use the Contour Layer as a prefix for all of the
hatch layers. For example, if the first hatch zone is set to be
drawn on the "Zone 1" layer and the Contour Layer is set to
"CTR", the actual layer name of the hatch will be "CTR Zone 1".
Set Index/Label Layers by Contour Layer: When enabled, this
option will automatically set the Index Layer and the
Text Layer to be the same as the Contour Layer.
However, you may also specify a prefix or suffix for each layer.
For example, if the Contour Layer is set to "CTR" and the Index
Layer Suffix is set to " Index", then the index contours will be
drawn on the "CTR Index" layer. It is important to note that this
option only sets these layer names when the command is first
executed or when the above dialog is opened, meaning that you may
still override these layer names if you wish.
Contour Interval/Values: This value is dependent on the
Contour by Interval toggle.
When the toggle is enabled, this value will set the
interval for the contours. For example a value of 2 will draw
contours along the grid values of 2, 4, 6, 8, etc. The first value
contoured will be the first value divisible by that contour value.
For example, if an interval of 3 is selected for a grid that ranges
from 5 to 20, the first contour will be drawn at a value of 6.
When the toggle is disabled, this value(s) will set the specific
value(s) to contour. For example, if a value of 10 is selected,
only one contour will be drawn where the grid has a value of 10.
Multiple contours may be drawn by entering values separated by
spaces. For example, entering "10 12 16" into this text box will
draw contours at values of 10, 12, and 16.
Specify Starting and Ending Elevations: When enabled, this
toggle will prompt you to enter the starting and ending values to
contour. For example, if the grid ranges in values from 0 to 100,
you can use this option to only draw contours for values ranging
from 30 to 60.
Color: This button will open the color palette, where you
can select the color for the contours. Please note that this does
not set the color of index contours.
Draw Index Contours: When enabled, this option will draw
some contours differently than the main contours. You can control
the setup of the index contours by clicking the Setup button
to the right of this toggle. When clicked, the below dialog will
appear.
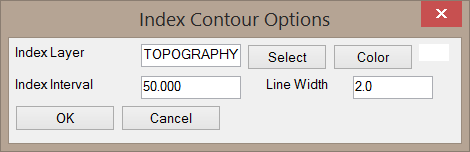
Index Layer: This sets the layer for the index
contours. You may select an existing layer by clicking the
Select button.
Color: This button will open the color palette, where you
can select the color for the index contours. Please note that this
does not set the color of non-index contours.
Index Interval: This value sets the interval of the index
contours. This value will default to be the Contour Interval
multiplied by 5.
Line Width: This value sets the width of the index contours.
The non-index contours will have a line width of 0 by
default.
Label Contour Lines: When enabled, this toggle will add
labels to the contours. The number of decimals in the labels is
controlled by the Decimals dropdown list. You can control
the setup of the labels by clicking the Setup button to the right
of this toggle. When clicked, the below dialog will appear.
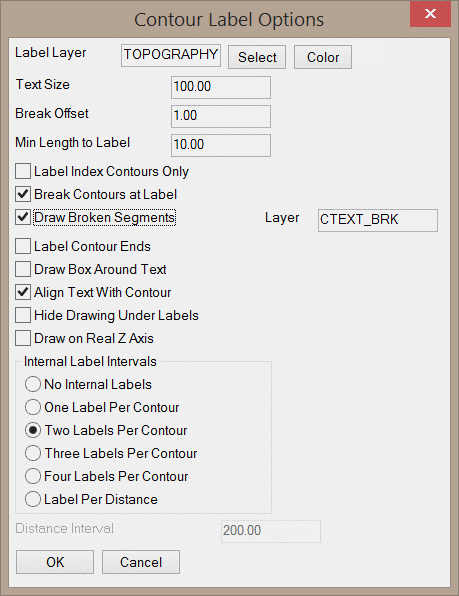
Label Layer: This sets the layer for the labels.
You may select an existing layer by clicking the Select
button.
Color: This button will open the color palette, where you
can select the color for the index contours. Please note that this
does not set the color of non-index contours.
Text Size: This value sets the height of the text in drawing
units.
Break Offset: This value sets the distance between the end
of the trimmed contour and the start/end of the text. This value is
only used when the Break Contours at Label toggle is
enabled.
Min Length to Label: This value sets the minimum length of
contours to be labeled. For example, if this value is set to 10, a
contour with a length of 5 will not be labeled.
Label Index Contours Only: When enabled, this toggle will
only add labels to index contours.
Break Contours at Label: When enabled, this toggle will
break the contour line near the label, making it easier to read the
labels.
Draw Broken Segments: When enabled, this toggle will draw
the broken segments of the contour (the portion of the contour
under the labels). These segments will be drawn on the layer
specified to the right of this toggle.
Label Contour Ends: When enabled, this toggle will draw
additional labels at the ends of contours. This option will not
draw additional labels on contours draw as closed
polylines.
Draw Box Around Text: When enabled, this toggle will draw a
box around the text labels.
Align Text with Contour: When enabled, this toggle will
align the label with the contour itself. When disabled, labels will
be aligned horizontally.
Hide Drawing Under Labels: When enabled, a WIPEOUT entity
will be draw around the labels, hiding the contour and any other
linework underneath it. This option has the same visual effect as
breaking the contour at the label, but allows you to retain a
continuous contour.
Draw on Real Z Axis: When enabled, labels will be drawn at
the same elevation as the contour. When disabled, labels will be
drawn at zero elevation.
___ Labels Per Contour: These radio buttons set the number
of labels to draw on each contour.
Label Per Distance: This radio button will draw a contour
label on a regular interval along the contour, set by the
Distance Interval value.
Smooth Contours: When enabled, the contours will be smoothed
to reduce sharp edges. You can control the smoothing options by
clicking the Setup button to the right of this toggle. When
clicked, the below dialog will appear.
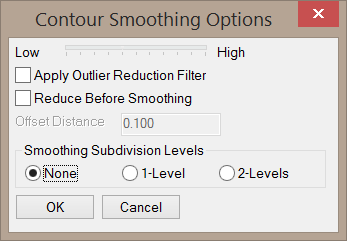
Low-High Slider Bar: This slider bar controls
the degree of smoothing. This is based on Bezier smoothing, which
holds all the original points calculated from
the grid and only smooths between the calculated points.
Apply Outlier Reduction Filter: When enabled, this toggle
will remove spikes in the contours that don't follow the general
trend direction.
Reduce Before Smoothing: When enabled, this toggle will
apply the
Reduce Vertices function to the contours before smoothing. The
Offset Distance is the maximum distance the contour is
allowed to move when removing vertices.
Smoothing Subdivision Levels: This option will
internally subdivide the grid cells with a quadratic smoothing
algorithm to help create smoother contours.
Reduce Vertices: When enabled, this
toggle will apply the
Reduce Vertices function to the contours. The Offset
Distance is the maximum distance the contour is allowed to move
when removing vertices.
Min Contour Line Length: This values sets the minimum length
required for contours to be drawn. For example, if this value is
set to 100, a contour with a length of 50 will not be drawn. This
filter helps to prevent drawing relatively insignificant
contours.
Contour Zone Analysis: This option controls how the contour
zones will be drawn. A zone is simply the space between two contour
lines.
None: The contour zone boundaries will not be
drawn. Only the contours themselves will be drawn.
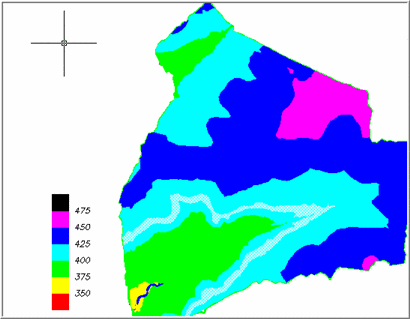
Hatch Zones: This option will draw the contour zone
boundaries and hatch them according to the below dialog. When this
option is selected, you will be prompted to pick a location to draw
a legend. It is recommended that you select an inclusion boundary
when using this option even if you are contouring the entire
grid.
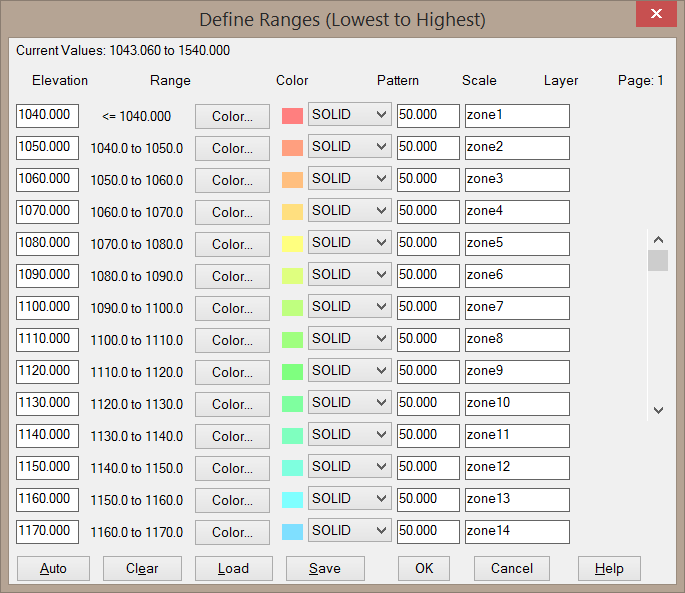
The above dialog controls the appearance of the hatch
zones. A description of each column is given below. Note that you
may need to scroll down to other pages to view all of the contour
zones.
Elevation: Sets the maximum contour value for
the zone.
Range: Displays the range of values included in the
zone.
Color: Sets the hatch color for the zone.
Pattern: Sets the hatch pattern for the zone.
Scale: Sets the hatch pattern scale for the zone.
Layer: Sets the layer for the hatch
pattern.
Clear: This button will clear all settings in the
dialog.
Auto: This button will display the below dialog, which will let
you automatically populate each hatch zone with various
properties.
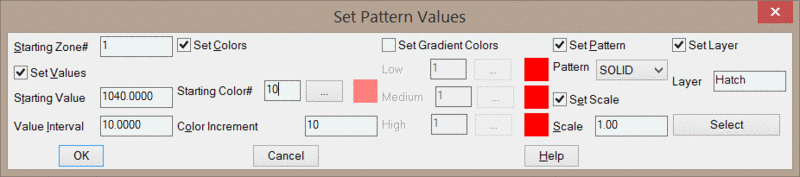
Starting Zone: This value sets the first zone to
be modified. If this value is set to 1, all zones in the dialog
will be modified. You can toggle the various options on this dialog
to only modify certain properties of each zone, however.
Set values: When enabled, the values of each zone will be
modified. The Starting Value sets the value of the first
zone selected. That value will increment by the Value
Interval value.
Set Colors: When enabled, the colors of each zone will be
modified. There are two ways to set the colors of the zones,
controlled by the Set Gradient Colors option.
When Set Gradient Colors is disabled, the colors
for each zone will be defined by a Starting Color # and a
Color Increment. The Starting Color # relates to a color in
the CAD color palette. The Color Increment sets the color for the
next zone. For example, if the Starting Color # is 10 and the Color
Increment is 2, the second contour zone will use color 12. The
default values of 10 and 10 will create a rainbow color gradient.
Similarly, a Starting Color # of 11 and a Color Increment of 10
will produce a lighter shade of the rainbow gradient. It can be
difficult to create other color gradients with this system, but the
other method of setting color allows for easier selection of other
gradients.
When Set Gradient Colors is enabled, you will be able to set
color gradients by selecting a Low, Medium, and
High color value. All intermediate colors will be selected
automatically. It should be noted that this command can only use
the colors from the CAD color palette, which includes 255 colors.
As a result, attempting to use this option with a large number of
hatch zones may result in some hatch zones using the same
color.
Set Pattern: When enabled, the pattern for each zone will be
set to the selected hatch pattern.
Set Scale: When enabled, the hatch pattern scale for each
zone will be set to the Scale value.
Set Layer: When enabled, the layer for each zone will be set
to the Layer value. You may select an existing layer by
clicking the Select button.
Create Polyline Topology: This option will draw the contour
zone boundaries, but will not hatch them. This option will add an
extra label in the zone boundary to indicate the range of grid
values in that zone. This can be useful for GIS applications in
other modules.
Extrapolate Grid to Full Grid Size: This option will extend
the contour lines to the rectangular limits of the grid when values
are left as null. Note that this will not modify the grid file
itself.
Prompts
Select the Inclusion perimeter polylines or ENTER for
none.
Select objects: pick a closed polyline for the contour
boundary if any
Select the Exclusion perimeter polylines or ENTER for none.
Select objects: pick a closed polyline for the area to
exclude
Grid File to Process dialog select a .grd file
Contour from Grid File options dialog
Extrapolate grid to full grid size (Yes/<No>)? press
Enter This prompt appears if your grid extends beyond the
limits of your data points in some areas.
Contours interpolated from GRID
Setting color ranges using "Hatch Zones"
option
Pulldown Menu Location: Surface >> Contour
from...
Keyboard Command: cntrgrd
Prerequisite: A grid file