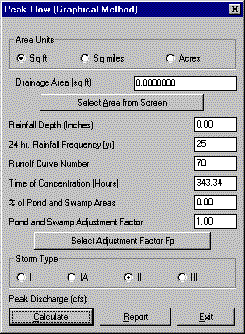
This command calculates peak flow using the graphical method from the TR-55 program. The program is run through the dialog shown below. The inputs in the top section default to the values from the Curve Numbers & Runoff and Time of Concentration routines. When all the inputs are entered, click on the Calculate button to obtain the peak flow at the bottom line. The peak flow value can then be used for Detention Pond Sizing or Channel Design.
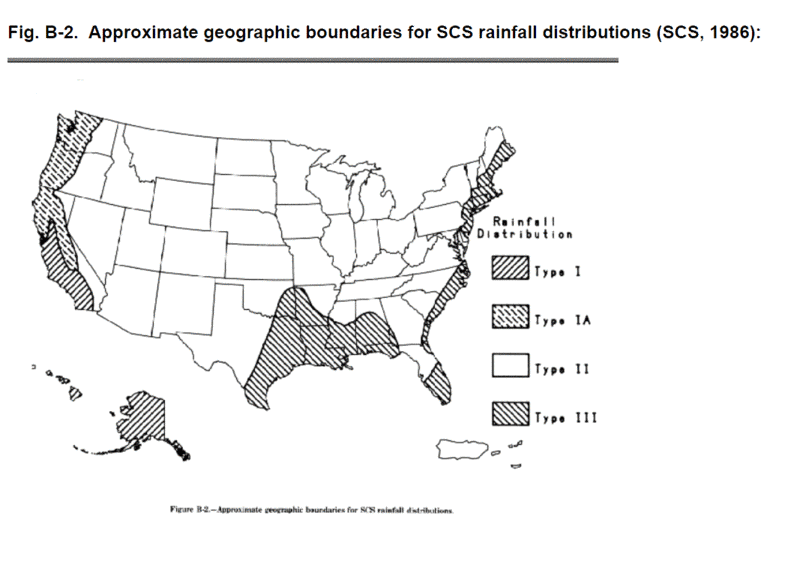
Graphical Peak DischargeMore information regarding the various storm types can be found at the below links:
Project: Parking By: TW
Date: 11/13/95
Location: West Checked: Date:
Developed
1. Data:
Drainage area:....................A = 27.1500 Acres
Runoff Curve Number:.............CN = 70
Time of Concentration:...........Tc = 0.75
2. Frequency........................yr = 100
3. Rainfall,P(24-hour)..............in = 6.00
4. Initial abstraction, Ia............ = 0.8571
5. Compute Ia/P....................... = 0.1429
6. Unit peak discharge, qu......csm/in = 410.22
7. Runoff,Q.........................in = 2.8052
8. Pond & swap adjustment factor,...Fp = 1.00
9. Peak Discharge,qp...............cfs = 48.8172
Pulldown Menu Location: Watershed
Keyboard Command: peakflow
Prerequisite: None