
1 Click the desktop icon for Carlson and start-up Carlson Software.
2 Once in Carlson, exit out of the Startup Wizard (if it appears) and click Open under the File pulldown menu. Look for the file Mantopo.dwg drawing in the "\Carlson Projects" folder and open it.
3 Select Triangulate & Contour from the Surface pulldown menu (within the Survey module). Click the Contour tab. Let's target contours at a 1-unit interval, and contour the area of points. You will see this dialog:

Make all settings as shown (most of them are the default). We want to make sure that the Contour Interval (top right) is set to 1. Also, be sure to set the Index Interval to 5. Click OK.
Select the points and breaklines to
Triangulate.
Select objects: ALL (All means select everything visible on
the screen)
Select objects: press Enter (for no more)
A dialog box appears. Select Mantopo.crd as your coordinate file.
Click Open and the points will be read from the crd file.
Range of Point Numbers to use
[<All>/Group]: press
Enter (to accept All)
Wildcard match of point description
<*>: press Enter
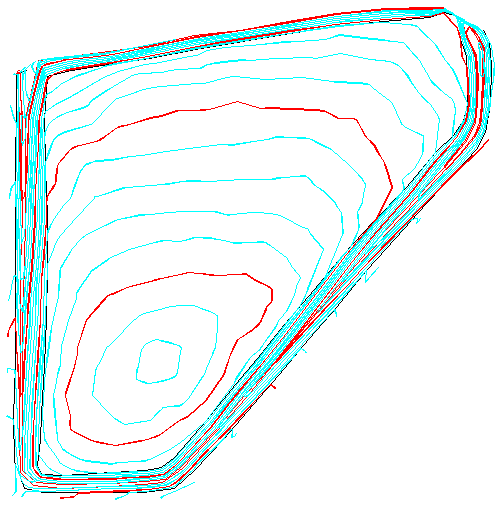
Contours are drawn, but notice the unacceptable wavy look around the perimeter, an area which is meant to be a ditch.
Type in U for Undo and press Enter until the new contours (at left) disappear and you are back at the command prompt.
4 Field-to-Finish: From within the Survey module (Settings > Carlson Menus > Survey Menu), under the Survey pulldown menu, select Draw Field-to-Finish.
You will be prompted for the CRD file to process. Choose the Existing tab, then select mantopo.crd, which resides in the main Carlson Projects folder, and click Open. The Draw Field to Finish dialog appears.
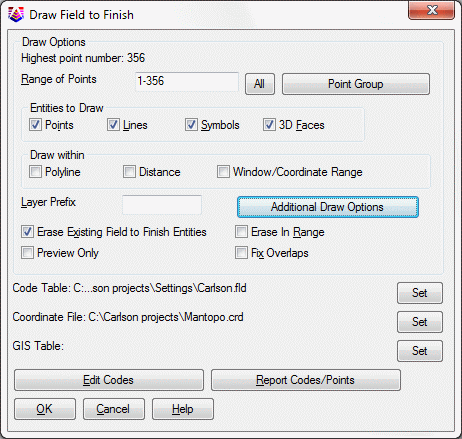
At the lower left of the Draw Field to Finish dialog, click Edit Codes/Points. The Field to Finish dialog appears.
On the left side of the Field to Finish dialog, under the heading Code Table, there is an option called Code Table Settings. Click on it. You will see this dialog:

As you can see at the top of the Code Table Settings dialog, the default Field to Finish code definition (.FLD) file is Carlson.fld. We want to make a new code table because the coordinate file for the field survey includes special coding (17 and 18) for ditch lines and top of banks.
You can react and adjust to whatever a field crew uses by making a new field-to-finish table that can load up the codes right from whatever descriptions were used in the field. To do this, click Set at the upper-right of the Code Table Settings dialog, then choose the New tab (for new file) and you might name it Mantopo, as shown below (noting the "\Carlson Projects" folder):

Click Open. You will be taken to the previous dialog.

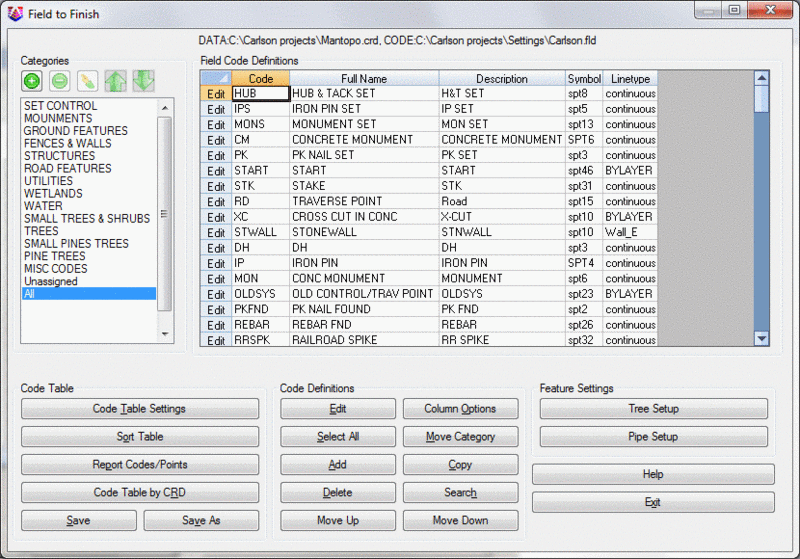
Notice how "Carlson Projects\Mantopo.fld" is now listed at the top. Click OK. You will return to the main Field to Finish table, completely empty, as shown below:

Now, get a jump start on the table by choosing the option Code Table by CRD (located in the lower left of the dialog). Choose Append on the subsequent dialog box (shown below).
In this lesson, we only care about code 17 and 18. Select all other codes (the GROUND code in this case) and click the Delete button to remove that Code from the list. Now select Codes 17 and 18 (by holding the CTRL or SHIFT key down while picking) as shown below.

Pick the Edit button under Code Definitions. The Multiple Set dialog appears.

Click the Entity button to establish the type of entity that should be drawn for codes 17 and 18 as shown below. Make all settings as shown in this box. We will turn them both into 3D polylines (which will act as break lines or barrier lines for contouring). Accept the 3D Polyline choice by clicking OK, then hit Exit, which will take you back to the Field to Finish dialog.
The last steps are to first to save the Field-to-Finish (.FLD) file Mantopo by clicking the Save button. Then click Exit (lower right) to draw the 3D polylines. You will see the following dialog which allows you to control the details of what to draw. Make sure the Lines option is the only entity to be drawn, not points, symbols, or 3D faces. Lets take a quick look at the Additional Draw Options.

Make sure that the Point Label Settings are set so that you can see the points properly.

Click OK to both dialog boxes. The following drawing is created. All the ditch lines and top of bank lines, because they were coded 17 and 18, are drawn in one quick procedure.

5 Because the field crew did not use start and stop logic (e.g. appending 7 or some agreed upon code to a description could end a polyline and start another), some polylines connect that should not. In particular, the line near the NW corner is clearly crossing the ditch line. It must be removed. Choose the Edit pulldown, then Polyline Utilities > Remove Polyline > Remove Polyline Segment.
Break polyline at removal or keep
continuous [<Break>/Continuous]? press Enter
Select polyline segment to remove:
select the polyline segment to the
right of point 127 indicated by the arrow below
You will recognize this as a long segment running from point 127 to
point 50.
Select polyline segment to remove:
press Enter (for no more)

6 Return back up to the Surface Menu, pick Triangulate & Contour and use the same Contour settings as before. Then do a right-to-left crossing selection as before (avoiding the stockpile at the lower right). Select the Mantopo.crd file again.
NOTE: You may be alerted of a crossing breakline scenario located at the northeast corner of the site. Use the Zoom To and Zoom In/Out buttons to explore the data geometry at this area of the site. As an optional exercise, experiment with the Draw Field to Finish > Edit Codes/Points > Edit Points routine to adjust the location(s) or coding of the offending point(s).
Now we get excellent contours, with a sharply defined ditch. Under View, do Freeze Layer and pick on a point. The points will freeze.
Here is the improved drawing, helped out by 3D polylines that were produced by Draw Field-to-Finish.
7 Delete Layer. Let's say that now you don't want the break lines in the drawing (since they can be easily re-created with Draw Field to Finish). You don't want to even freeze them; you want to fully delete them. There is a command for that under Edit. Pick Erase, sliding over to Erase by Layer. This dialog appears:

If you know the layer names, you can just type them in. If you know where they are but not their names, then click on Select Layers from Screen. If you'd recognize the layer name if you saw it in a list, click Select Layers by Name. Click on Select Layers by Name and pick 17 and 18, then OK twice. Notice the change in the drawing.
8 Explode. Inserted Drawings should be exploded so you can work with their individual components. From the View pulldown, choose the Window command and window in on the stockpile at the lower right of the drawing. If you type E to Erase, and try to erase any aspect of the stockpile, the whole stockpile will erase with all its features. That is because the Stockpile was another drawing inserted into this drawing. Sometimes other drawings that are inserted are referred to as Blocks. In any case, this stockpile "block" needs to be exploded. Explode just breaks it up into its unit objects which then start to behave normally. Select Explode under Edit and slide over to Standard Explode. Then pick the stockpile. It is now a set of normal objects.
It's also worth noting that while the block has been exploded, it still exists in the drawing as a block definition. This means that now that it's exploded it is taking up twice the amount of storage space in the drawing. As such, you should purge the drawing of the unused block, or turn on the explode toggle when inserting one drawing into another. As a basic rule, if it's a symbol, don't turn on the explode toggle; if it's a complete drawing, turn it on.
9 Change Elevations. Let's assume our stockpile drawing is too high and should be lowered in elevations by 540 units. To best see the effect of this command, bring back the points by selecting Thaw Layer under View. Now select the Edit pulldown, and then Change > Elevations.
Type of elevation change
[Absolute/<Differential>/Scale]: D
Positive number increases, negative number
decreases elevation.
Elevation difference <0.00>: -540
Ignore zero elevations
[<Yes>/No]? press
Enter
Change Layer for changed entities
[Yes/<No>]: press
Enter
Select Entities for Elevation Change.
Select objects: do a lower right pick
to upper left pick (automatic crossing) selection around the
stockpile
Select objects: press Enter (for no more)
Notice in the drawing below how the points, breaklines and contour polylines have changed in elevation with the exception of the contour text.

Initiate the command List Elevation under the Inquiry pulldown, pick on an index contour, and notice how the elevation has indeed changed. Repeat step 7 and delete the layer CTEXT, so as to remove the 5 index contour elevations, which are no longer accurate.
10 Volumes by Layer. One of the signature commands of Carlson, Volumes by Layer, will produce accurate volumes without making any files. The only prerequisite is that the data for the existing and final surfaces exist in the drawing on separate layers. It is also very important to have an inclusion perimeter to define the limits where the volumes should be calculated. In our example, the original ground will be the 3D polyline connecting points 1 through 15, and everything else above will be the final ground (including the 3D perimeter itself).
Make sure that you are in the Civil module (Settings > Carlson Menus > Civil Menu). Select Volumes by Layers. This command is found under the Surface menu.
Pick Lower Left limit of surface
area: pick below and to the
left of the stockpile, but as close as possible to the
stockpile without clipping it in the window
You want to totally include it, but with little wasted
margin.
Pick Upper Right limit of surface area:
pick above and to the right of the
stockpile
A dialog appears:

We will stick with the defaults, as shown. Notice that we are using 50 grid cells within our window and since our window was not a perfect square, the cell sizes are not whole numbers. In this example it is 6.73 x 5.32. You may have slightly different sizes. Seeing this, if we wanted 5 x 5 cell size, we could click the Dimensions of a Cell option and set the size to 5 x 5. Hundreds or thousands of cells in both directions will increase calculation time. You can experiment with more cells or, if you prefer, smaller cells (which makes more cells). However, you will begin to see diminishing returns in terms of accuracy changes as your cell size continues to shrink. After a while (depending largely on the spacing of the source data), tighter, smaller cell sizes don't add any value to the precision of the calculation. Click OK.
Then pick the layers that define the existing ground (PERIMETER) and the layers that define the final ground (PERIMETER, PNTS, BARRIER, CTR, CTRINDEX).

Then click OK. Notice how the Perimeter layer is common to both. If you want to be a master of volumes, remember this as a mantra: The perimeter should be a 3D polyline in a distinct layer, common to both surfaces. A stockpile is just a special case in that sometimes the 3D perimeter is all you know about the base surface.
When asked to Select objects, do a right-to-left (crossing) selection of the entire stockpile area. Lastly, you will be asked for the inclusion perimeter (pick the perimeter polyline) and the exclusion perimeter (none). This leads to a flexible reporting and output dialog:

Elevation Zone Volumes, for example, would produce volumes in any desired increment from the base of the stockpile going up. If the stockpile consists of coal (80 lbs/c.f.), then Report Tons can be clicked on and a Density value entered.
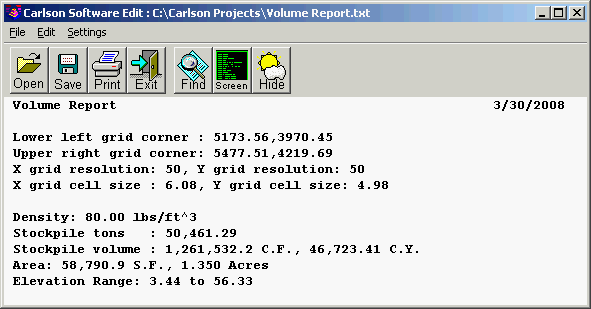
Click OK, and the basic report is produced, as seen below.

Click the Exit icon to return to the command prompt.
11 Stockpile Volumes. Our Stockpile is naturally well-suited for applying the simplest volume command of all Stockpile Volumes. It requires that the 3D perimeter polyline for the stockpile be placed in a layer called Perimeter, which ours is. So let's try it.
Select Calculate Stockpile
Volume found under the Surface > the Stockpile/Ponds/Pit
Volumes menu.
Ignore zero elevations
[<Yes>/No]? press
Enter
Reading points ...
Select stockpile entities and perimeter. crossing select (right-to-left picks) the entire
stockpile area
The grid resolution dialog (note that it is still at 50x50) appears again. Click OK. A report is generated.
This completes the Lesson 7 tutorial: Contouring, Break Lines and Stockpiles.