Data Extraction for HydroCAD
This lesson covers extracting watershed data for HydroCAD
stormwater modeling using Carlson Hydrology. The goal of this
functionality within Carlson Hydrology is to automatically extract
the sub-areas needed by HydroCAD to do its stormwater modeling.
There are 3 main considerations to prepare a dataset for
extraction.
1) Watershed (subcatchment) delineation, with either
a. Longest flow path and average slope information for Curve
Number/Lag method, or
b. Tc with sheet, shallow, and channel flow information
defined for TR55 method
2) Delineation of Hydrologic Soil Group (HSG) with
a. HSG boundaries defined on one layer and
b. HSG labels on another layer
3) Ground cover delineation, with
a. Each type of different ground cover area defined as
closed polylines on specific layers, corresponding with entries in
the hydrocad.rcl library
Note: The default location for the data files for this lesson is
C:\Carlson Projects. The data files are: HydroCAD_Tutorial.dwg and
HydroCAD_EG.tin.
Layer Based Process
The entire process described herein is essentially a layer based
process, meaning that it is the drawing layers that everything is
created on that makes the process work. So before going any
further, take a look at the dialog box in which those layers are
defined. On the HydroCAD menu, pick Define Watershed
layers. In this dialog box, pick the Load button and load the
hydrocad.rcl file that is in the Settings folder. After
loading, make sure the HydroCAD radio button at the top of the
screen is selected.

Any layer names in this dialog box can be changed to whatever you
like, but the linework created must use the layers you decide
on. A helpful trick is to highlight the layers in the list
that you think you will need for the project at hand (using the
Ctrl key) and then pick the Create Layers button. The layers
will be created for you, thereby eliminating the need to type them
all in by hand, and also avoiding typos that will cause the data
extraction to fail. The layers in the drawing must match the
names in the list exactly.

Now that the layers are established, you can focus on creating the
geometry in the drawing.
Watershed/Subcatchment
Delineation
If there is a surface (TIN) for the project site, Carlson Hydrology
can greatly aid in the process of delineating watersheds
(subcatchments) and determining the longest flow path for each
subcatchment. These tasks are accomplished in Hydrology,
under the Watershed menu, or the HydroCAD menu, using the Watershed
Analysis command.

Pick the surface for the site. Setting up the watershed panel
as shown:

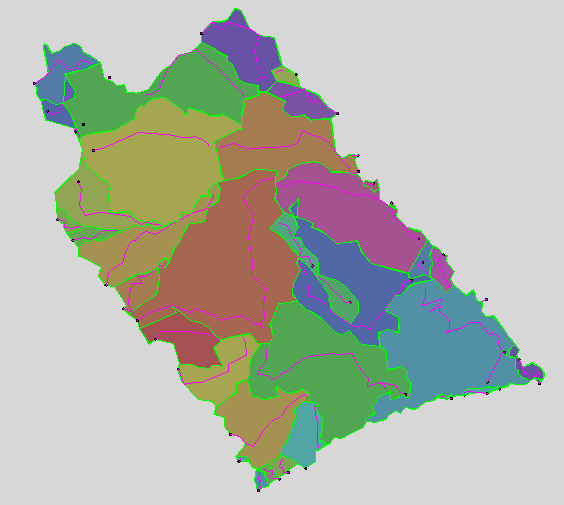
Click Draw Watersheds, this will generate:
Once the watersheds and max flow lines are drawn, you can make
decisions on them…are there too many, too few…etc…
Tip: to combine several into one, use Draw – Shrink Wrap…use the
Bound method, pick a bunch of watersheds, and a new boundary will
be drawn around them.
Ultimately, you should be left with a closed polyline for each
watershed, and a single 3D polyline within each watershed
representing the longest flow path:

The subcatchments will need to be labeled on the correct layer, but
this part of the process is essentially complete. These
subcatchment delineations can be done using any process
desired...looking at the contours, looking at aerial photos,
whatever method is most useful and comfortable is fine. It is
the end result of linework that delineates the areas that is
needed...the method to get them is inconsequential.
Soils (Hydrologic Soil
Group)
The same statement holds true for HSG delineation. What
you’ll need, ultimately, from whatever source(s) you start from, is
a drawing with the soil groups drawn as polylines, all on one
layer, and the HSG types (A, B, C, or D) labeled within the areas
on another single, specific layer. The soil areas must be
closed, but do not have to be individual specific closed
polylines. The software will run a bpoly on each area to
“close” it. The soils information can come from a SHP file
from NRCS, from a ground soils survey, from digitized plans...it
doesn't matter, the only thing necessary is the linework and
labels.

Ground Covers
Finally, ground covers. In standard use, this term applies
only to the ground cover, which is independent of the underlying
soil group(s). Neither layer equates to a specific CN value,
which can only be determined after we analyze the intersection of
these layers. The actual CN value(s) will be assigned by
HydroCAD after this analysis is complete.
Once again, with whatever method you like, create closed polylines
on the various ground cover layers.

Putting it all together
Now that you’ve draw all the watershed and site data, we can
start to extract the information we need for hydrologic
analysis.
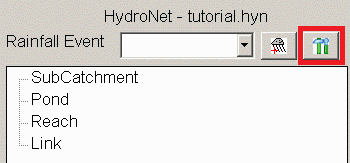
On the HydroCAD menu, pick HydroNet Explorer. In the file
dialog, pick the New tab and create a new .HYN file.
In the docked dialog, pick the Settings button at the upper-right,
with the tools on it.
In the Settings dialog box, on the General tab, set the Surface
File to your surface.

On the
SubCatchment tab, set the Calculation Method to Curve Number/Lag,
and clear the box to Process Curve Numbers, as they will be
determined in HydroCAD. Pick OK.

You are ready for the data extraction to be performed, and the
results exported to HydroCAD.

From the main HydroNet dock dialog,
pick the Update button (the up arrow). Then there is a dialog with
the options for the update. Select all the options as shown.

The subcatchments are listed in the HydroNet Explorer.
Double-clicking on any subcatchment name brings up a dialog with
its data. Note the same subcatchments now exist in HydroCAD,
ready for any further analysis and/or reporting.
The Edit button next to the Area shows all of the sub-area
statistics.

Double-clicking a subcatchment in HydroCAD opens the
Hydrograph and Summary report windows.


Project reports can also be
generated for Nodes, Areas and Soils.


