 Label Contours
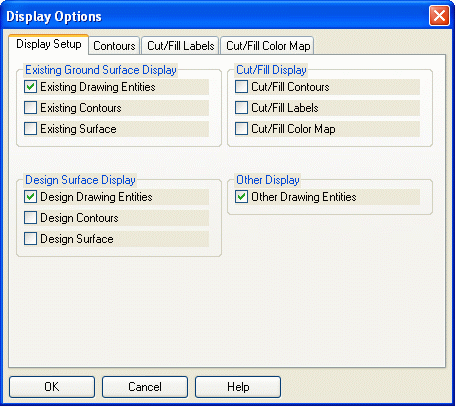 Display Setup: Here is the master list
for the major things you can display, including: the Entities,
Contours, and Surface for both the Existing and Design, Cut/Fill
Displays, and Other Drawing Entities.
Display Setup: Here is the master list
for the major things you can display, including: the Entities,
Contours, and Surface for both the Existing and Design, Cut/Fill
Displays, and Other Drawing Entities.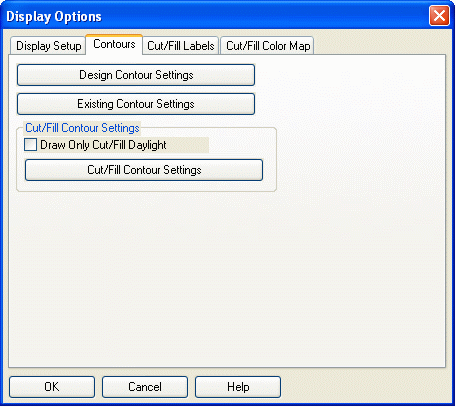 Contour Options: Here you can set the
interval, the elevation difference between each contour, for the
Existing, Design and Cut/Fill by clicking on their Contour
Settings. You can also choose to draw only the daylight line
between Existing and Design instead of the Cut/Fill contours at an
interval.
Contour Options: Here you can set the
interval, the elevation difference between each contour, for the
Existing, Design and Cut/Fill by clicking on their Contour
Settings. You can also choose to draw only the daylight line
between Existing and Design instead of the Cut/Fill contours at an
interval.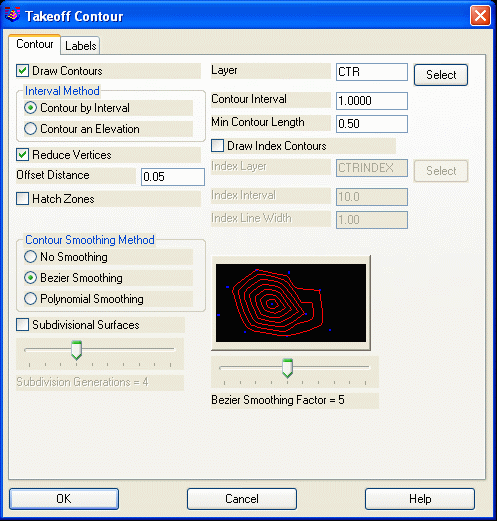 Draw Contours
When this box is checked, the program will draw contour lines after triangulating. Otherwise, only the designated triangulation operations are performed. Specify the layer for contours in the edit box to the right.
Contour by Interval or Contour an Elevation
Select whether to contour by interval (ie: every 10 feet) or to
contour a certain elevation. The elevation option allows you to
contour specific values. For example, if you want just the 100ft
contour, then select elevation and enter 100. The default mode is
by interval.
Contour Interval
Specify the interval to contour. Note: If the above option is set to Contour an Elevation, then this field is used to specify the elevation to contour.
Minimum Contour Length
Contour lines whose total length is less than this value will not be drawn.
Reduce VerticesThis option attempts to remove extra vertices from the contour polylines which has the advantages of a faster drawing and smaller drawing size. Default is ON
Offset Distance
When the Reduce Vertices option is enabled, This value is the
maximum tolerance for shifting the original contour line in order
to reduce vertices. The reduced contour polyline will shift no more
than this value, at any point, away from the original contour line.
A lower value will decrease the number of vertices removed and keep
the contour line closer to the original. A higher value will remove
more vertices and allows the contour line to shift more from the
original.
Hatch Zones
When activated, this option will allow you to hatch the area between the contours sequentially. A secondary dialog will load allowing the user to specify the hatch type and color.
Draw Index Contours
This option creates highlighted contours at a specified interval. When enabled, the fields for Index Layer, Index Interval and Index Line Width are activated.
Contour Smoothing Method
Select the type of contour smoothing to be performed. Bezier smoothing holds all the contour points calculated from the triangulation and only smooths between the calculated points. Polynomial smoothing applies a fifth degree polynomial for smooth transition between the triangulation faces. The smoothing factor described below affects the smoothing bulge.
Bezier Smoothing Factor
The contour preview window shows you an example of how much smoothing can be expected at each setting. Sliding the bar to the left results in a lower setting which have less looping or less freedom to curve between contour line points. Likewise, moving the slider to the right results in a setting that increases the looping effect.This option causes each triangle in the triangulation surface
model to be subdivided into an average of three smaller triangles
per subdivision generation, with the new temporary vertices raised
or lowered to provide smoother contours. More generations increases
the smoothness of the algorithm at a cost of increased processing
time. If Straight Lines are chosen as the contouring drawing
method, then the contours are guaranteed never to cross. The
original points of the surface model are always preserved. These
modifications to the surface model are only for contouring purposes
and are not written to the triangulation (.FLT) file or inserted
into the drawing. If some contour movement is too small for
appearance's sake, consider enabling Reduce Vertices.
Label Tab
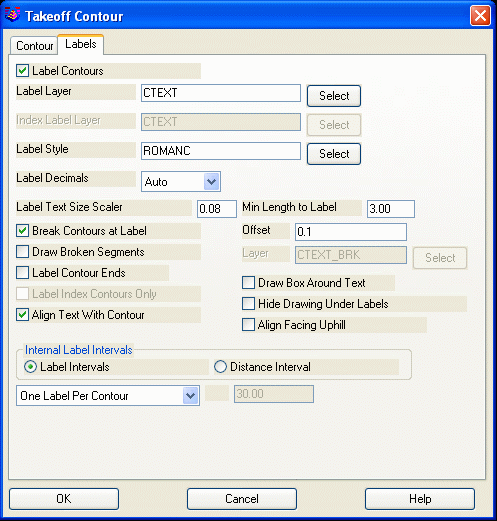
Label Contours
When activated, contours will be labeled based on the settings below.
Label Layer
Specifies layer name for intermediate contour labels.
Index Label Layer
Specifies layer name for index contour labels.
Label Style
Specifies the text style that will be used for the contour label text.
Label Text Size Scaler
Specifies the size of the contour labels based on a multiplier of the horizontal scale.
Min Length to Label
Contours whose length is less than this value will not be labeled.
Break Contours at LabelWhen checked, contour lines will be broken and trimmed at the
label location for label visibility. When enabled, the Offset
box to the right activates. The Offset determines the gap
between the end of the trimmed contour line and the beginning or
ending of the text.
Draw Broken Segments
When checked, segments of contours that are broken out for label visibility will be redrawn as independent segments. Specify the layer for these broken segments in the box to the right of this toggle.
Label Contour Ends
When checked, contour ends will be labeled.
Draw Box Around Text
When checked, a rectangle will be drawn around contour elevation labels.
Label Index Contours Only
When checked, only the index contours will be labeled.
This option is active only when "Draw Index Contours" has been
selected in the Contour tab of the main dialog.
Hide Drawing Under Labels
This option activates a text wipeout feature that will create
the appearance of trimmed segments at the contour label, even
though the contour is fully intact. This feature provides the
user with the best of both worlds; you have clean looking contour
labels, and the contour lines themselves remain contiguous.
This feature will also hide other entities that area in the
immediate vicinity of the contour label.
Align Text with Contour
When checked, contour elevation labels will be rotated to align
with their respective contour lines. This option also
activates the Align Facing Uphill feature explained below.
When checked, contour elevation labels will still be rotated to
align with their respective contour lines, but the labels will be
flipped in such a manner that the bottom of the text label will
always be toward the downhill side of the contours. So as the
labels are read right side up, you are always facing
uphill.
Internal Label Intervals
Choose between label intervals or distance interval. Label intervals will label each contour with a set number of labels. Distance interval lets you specify a distance between labels. Cut/Fill
Label Options: Here you can customize the Cut/Fill labels.
Text can be added either before or after the Cut/Fill amount, the
Existing elevation, and the Design elevation with the Prefix and
Suffix fields. You can also choose whether or not to display the
Existing Surface elevations, the Design Surface elevations and
Strata Cut Thickness. The colors for the Cut, Fill, Existing
Elevation, and Design Elevation text are all customizable. Carlson
TakeOff gives you the option to draw a marker symbol for where each
label represents. You can also hide the drawing under the labels so
that you can read the labels clearly. Text Size chooses the text
size for each line of the label. Text Style allows you change the
Font Style displayed in the labels. Decimal Places sets to how many
decimal places the labels will report. The Spacing of the labels
can be determined by intervals or by a selected number of spaces.
The size of each space is determined by the Text Size.
Cut/Fill
Label Options: Here you can customize the Cut/Fill labels.
Text can be added either before or after the Cut/Fill amount, the
Existing elevation, and the Design elevation with the Prefix and
Suffix fields. You can also choose whether or not to display the
Existing Surface elevations, the Design Surface elevations and
Strata Cut Thickness. The colors for the Cut, Fill, Existing
Elevation, and Design Elevation text are all customizable. Carlson
TakeOff gives you the option to draw a marker symbol for where each
label represents. You can also hide the drawing under the labels so
that you can read the labels clearly. Text Size chooses the text
size for each line of the label. Text Style allows you change the
Font Style displayed in the labels. Decimal Places sets to how many
decimal places the labels will report. The Spacing of the labels
can be determined by intervals or by a selected number of spaces.
The size of each space is determined by the Text Size. Cut/Fill
Color Map Options: Number Of Subdivision Rows is the number
of blocks both horizontally and vertically in the Color Map. If the
box reads 100 that means 100 blocks left to right and 100 blocks up
and down or 10,000 total pixels. A higher the Number Of Subdivision
Rows will make the Color Map sharper, however too high number can
cause Carlson TakeOff to run slower. Auto Set Range will
automatically set the red to blue scale for your cut/fill levels.
However, if you desire greater contrast, then use Max Cut/Fill
Range to manual set the range. Use lower numbers for greater
contrast. There are several coloring schemes with different
Cut-Daylight-Fill colors. For example, the Red-White-Blue scheme
means red for cut, white for daylight and blue for fill.
Cut/Fill
Color Map Options: Number Of Subdivision Rows is the number
of blocks both horizontally and vertically in the Color Map. If the
box reads 100 that means 100 blocks left to right and 100 blocks up
and down or 10,000 total pixels. A higher the Number Of Subdivision
Rows will make the Color Map sharper, however too high number can
cause Carlson TakeOff to run slower. Auto Set Range will
automatically set the red to blue scale for your cut/fill levels.
However, if you desire greater contrast, then use Max Cut/Fill
Range to manual set the range. Use lower numbers for greater
contrast. There are several coloring schemes with different
Cut-Daylight-Fill colors. For example, the Red-White-Blue scheme
means red for cut, white for daylight and blue for fill.