Gantt Charts
Gantt Charts are used to show the starting and ending dates for
scheduled events, making it simpler to understand the progress of
the project. These charts can be created for scheduling commands
including Underground Timing, Surface Equipment Timing, and Spoil
Placement Timing. Underground Timing and Surface Equipment Timing
are very similar commands, and thus Gantt charts are made in the
same way for both commands. The below example shows Gantt charts
used with these commands. Gantt charts for Spoil Placement Timing
appear on a slightly different dialog, but all functionality is the
same.
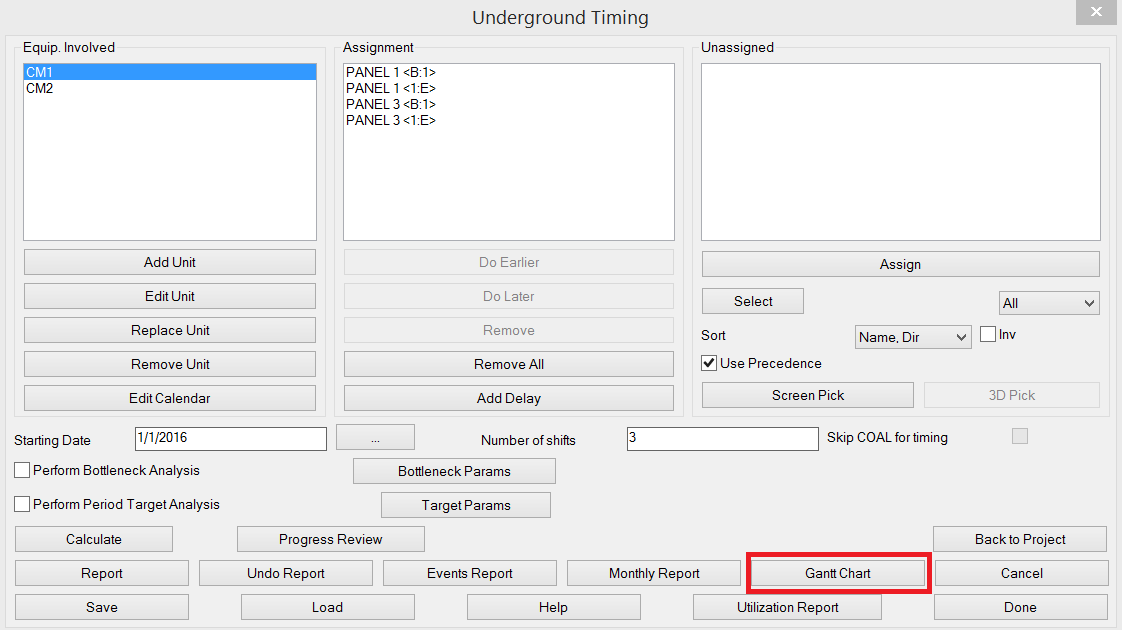
In the Underground and Surface Equipment Timing dialog shown below,
panels have been assigned to equipment. Clicking ‘Calculate’ will
make the ‘Gantt Chart’ button available, as outlined in red in the
below image.
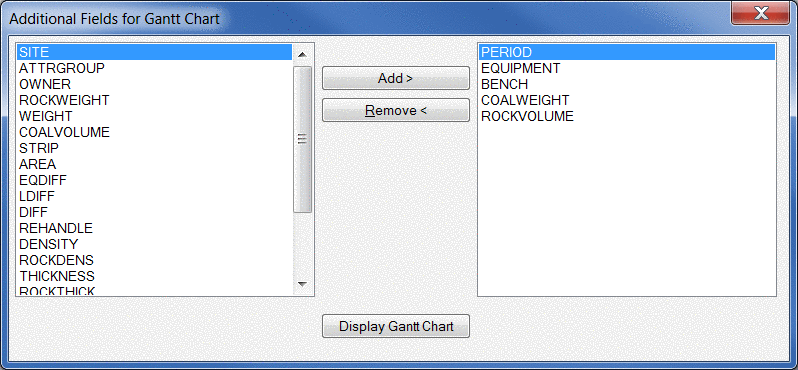
Clicking the ‘Gantt Chart’ button will open the dialog for
Additional Fields for Gantt Chart shown below. This screen allows
to Add> items from left to right to include in the chart
report.
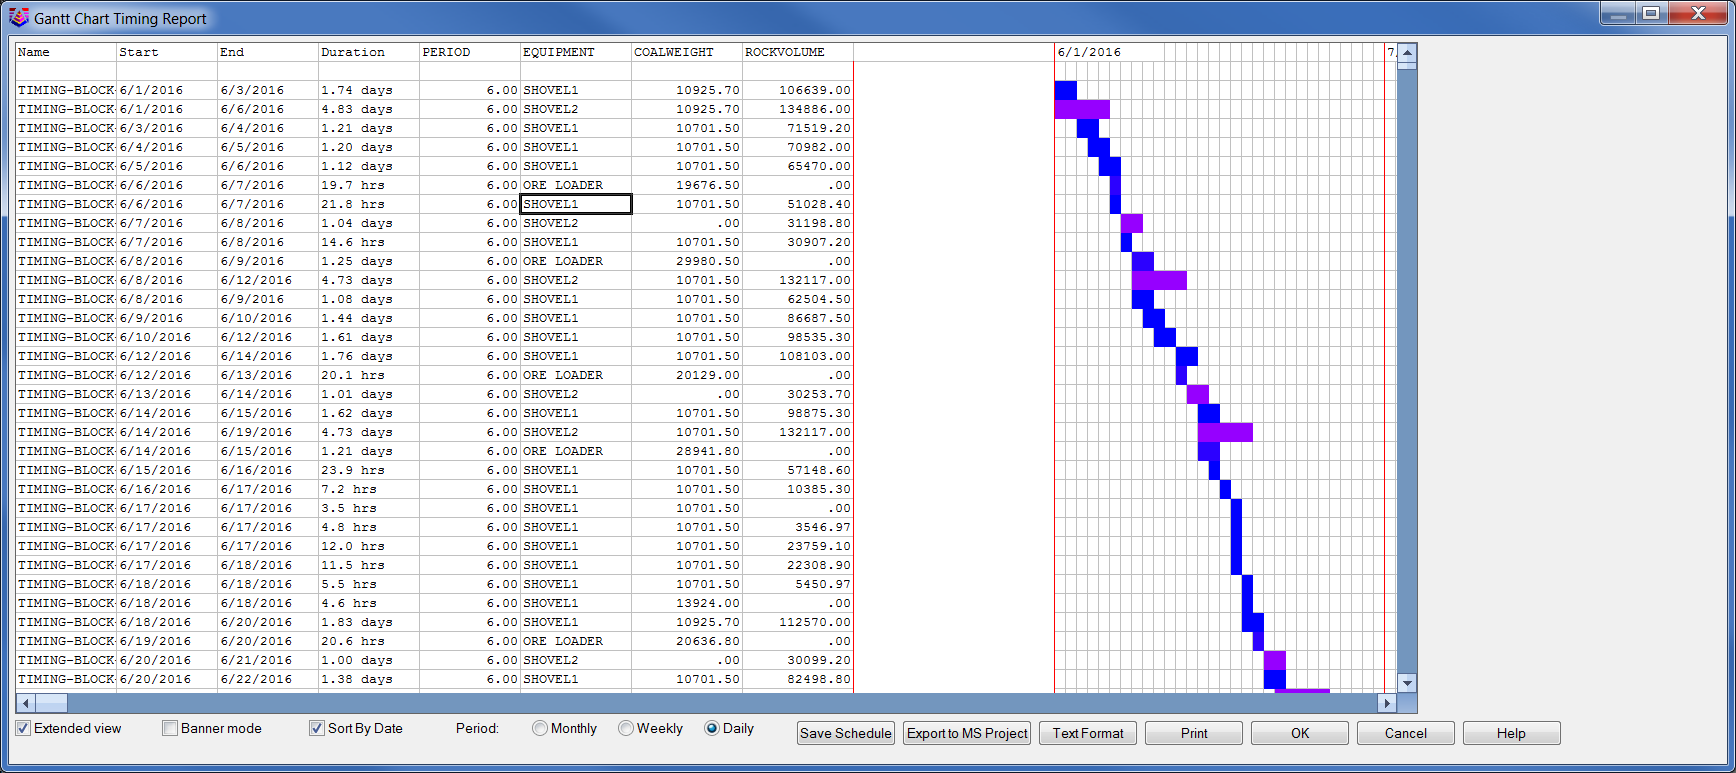
- Extended View: This option will toggle the first four
columns of the Gantt chart. If this option is turned on, the Gantt
chart will be shown as above. If this option is turned off, the
first four columns of the Gantt chart will not be shown.
- Banner Mode: This option changes how the chart is
printed. When this option is turned on, the chart will be printed
on multiple pages. This maximizes the chart on each page and makes
it more readable, which is very helpful when printing a complex
schedule. When this option is turned off, the chart will be scaled
to fit on a single sheet. For complex schedules, this can result in
an unreadable chart. However, you can change the size of the print
paper if you would like to keep the chart on a single sheet.
- Sort By Date: This option sorts the rows by the dates of
the schedule. This is useful to see all the equipment grouped
together in the chart.
- Period: This option sets the time duration of each cell
of the Gantt chart. In the above example, the ‘Daily’ option is
used. In this case, each cell of the Gantt chart represents one
day.
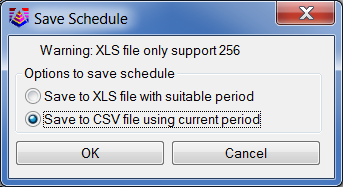
- Save Schedule: This option will allow you to save the
Gantt chart to an Excel spreadsheet that is limited to 256 fields,
or to a CSV file, which is unlimited.
- Export to MS Project: This option will allow you to
export the Gantt chart to an XML file, which can be imported into
Microsoft Project. A detailed description of this process is
provided further down in this document.
- Text Format: This option allows you to set the format of
the text of the exported chart.
- Print: This option allows you to print the Gantt chart
to any of the printers installed on your computer, or to save it
as PDF file.
Opening CSV file with MS Project
This section describes how to open a CSV file iwth MS Project.
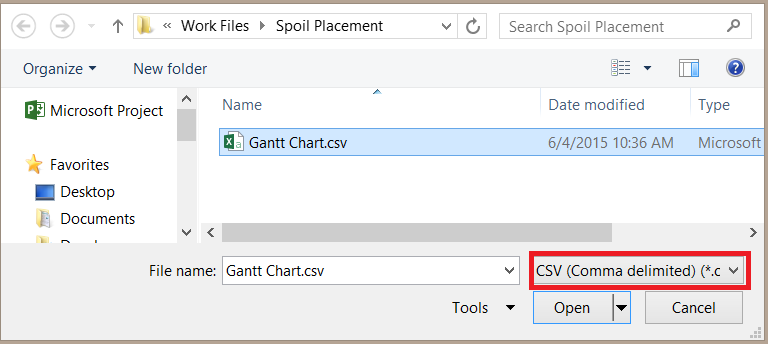
Before opening the .csv file, you will need to enable Legacy
Formats. This can be done via File Menu > Options > Trust
Center > Trust Center Settings > Legacy Formats > Allow
loading files with legacy or non-default file formats. Note that
this refers to Microsoft Project 2013. With this setting enabled,
you may open an existing file and specify the format as a .csv as
shown below:
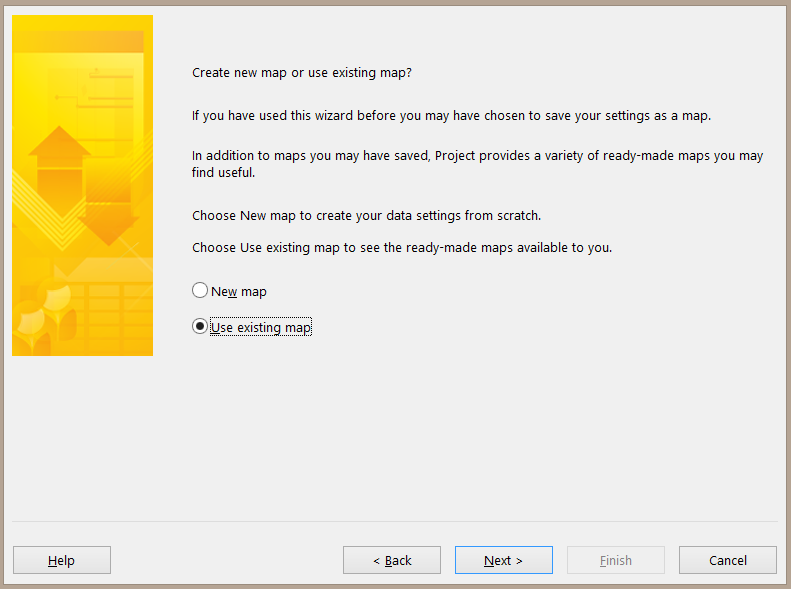
This will open the Import Wizard. On the ‘Map’ dialog, select ‘Use
existing map’ and click Next.
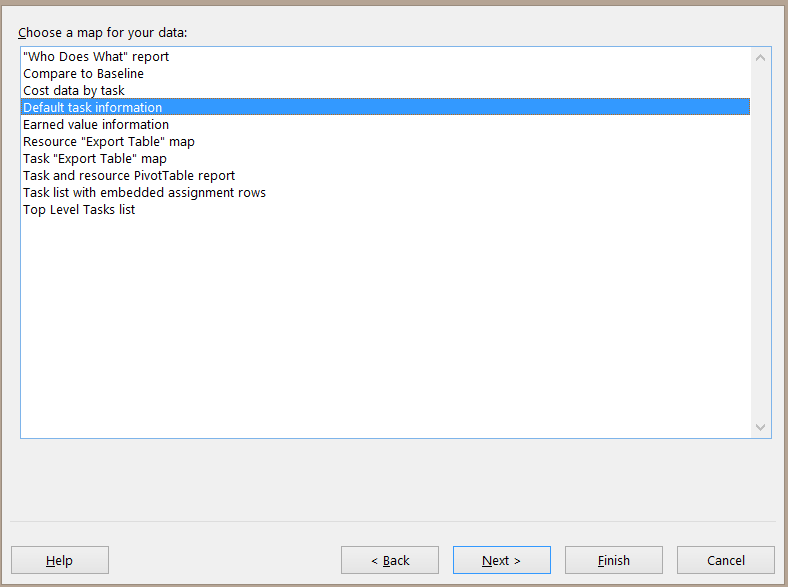
On the ‘Map Selection’ dialog, select ‘Default Task Information’
and click Next.
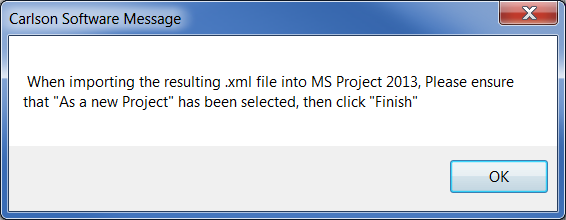
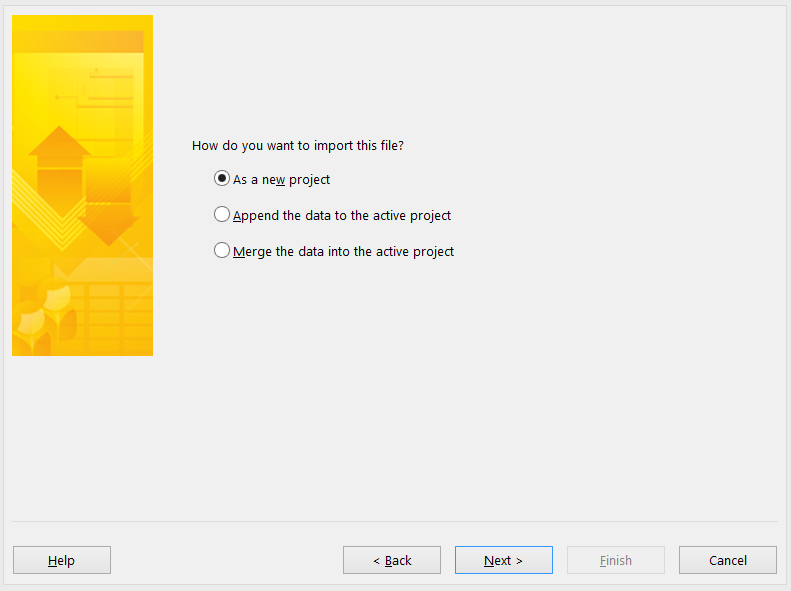
On the ‘Import Mode’ dialog, select ‘As a new project’ and click
Next.
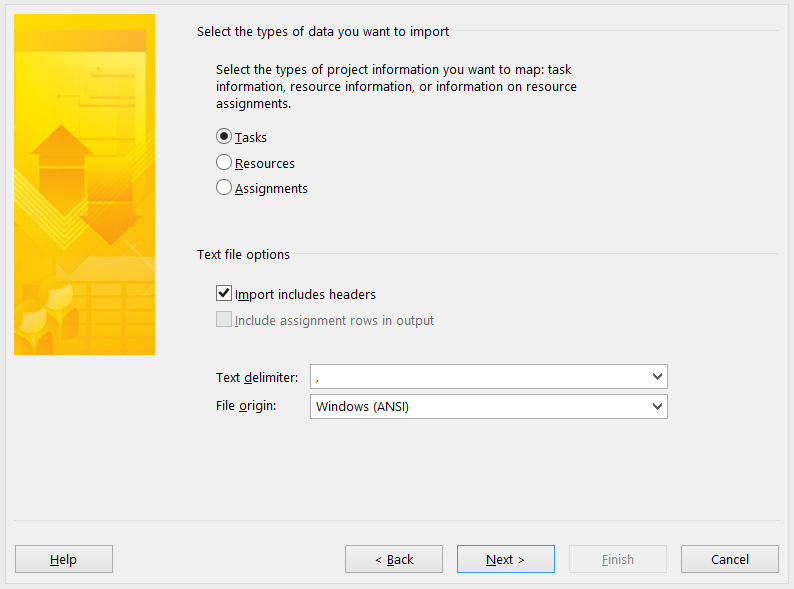
On the ‘Map Options’ dialog, use the settings shown below and click
Finish.