
This command draws the 3D grid mesh of the chosen grid (.GRD) file. Each grid cell can be drawn as a 3D Face entity, Polyface mesh, Text or temporary lines. 3D Faces and Polyface Meshes can be viewed/used in the following commands: 3D Viewer Window, Viewpoint 3D, Hide, Shade, 3D Surface FlyOver, and Slope Zone Analysis.
If Use Vertical Exaggeration is checked, grid elevations are multiplied by the value specified.
Exaggeration Method specifies whether to use an Absolute exaggeration method or Relative to Base, which uses the specified base elevation.
Specify the type of entities to draw in Draw Method. 3D
Faces are described above. The Preview Only option draws the grid
using temporary vectors. This method provides a much faster way to
view the grid. However these temporary vectors are erased when the
viewport is modified. This means as soon as you execute zoom,
redraw, regen or plot, this grid will disappear. You can quickly
redraw the grid by typing in VG for View Grid at the command
prompt. Polyface Mesh is similar to 3D Faces except it is a single
entity. The Text option will label the grid elevation at the grid
corner. The text is placed center justified over the grid corner.
To reduce clutter, there is an option to skip rows and
columns.
Specify the layer for the grid entities in Layer Name.
Specify the initial viewing direction in View.
When Color by Elevation is checked, the grid will be
colored based on a table of user-defined elevation ranges and the
assigned colors. There is also an option to subdivide the grid
cells at the color zone transitions. This is similar to the
Elevation Zone Analysis command. Use the Specify Elevation Zones
command to define ranges and colors.
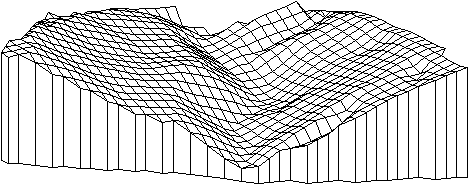
When Draw Side Faces is checked, the program will draw vertical faces around the perimeter of the grid. The side faces will be drawn vertically from the grid perimeter to the Sides Base Elevation. You may optionally specify the Sides Base Elevation, it defaults to 0.00.
When checked, Reverse Face Order changes the direction of the points for a grid cell from clockwise to counterclockwise. The order applies to shading the grid cell in 3D render viewers such as the 3D Viewer Window command. The grid cell will only appear shaded when viewing the grid cell from the clockwise side. Viewing from the other side will show a wire frame. The default is to show the shaded side from the top-down view. This option allows you to draw the grid so that the underside of the grid is shaded.
When checked, Draw Corners Only will draw the side lines only at the grid corners. Otherwise side lines are drawn down each perimeter grid cell.
When checked, Extrapolate Grid to Full Size draws the entire rectangular surface of the grid.
When Use Inclusion/Exclusion Perimeters is checked, it allows you to select inclusion and exclusion areas. Only grid cells inside the inclusion polylines will be drawn. Grid cells inside the exclusion polylines will not be drawn.
When checked, Subdivide Grid Around Inclusion Perimeter subdivides grid cells that are partially inside and outside the perimeter into smaller resolution grid cells.
|
| Drawn
grid file using inclusion perimeter and side faces option viewed with Viewpoint 3D |
Pulldown Menu Location: Surface >> Draw Surface
Keyboard Command: plotgrid
Prerequisite: a grid (.GRD) File