Draw Super Elevation Diagram
This command draws the station and slope diagram for a template
grade ID from data in a Template Grade Table (TGT) or Super
Elevation Diagram (SUD) file. The Super Elevation Diagram (.SUD)
file can be created with the Process Road Design or the Road
Network commands.
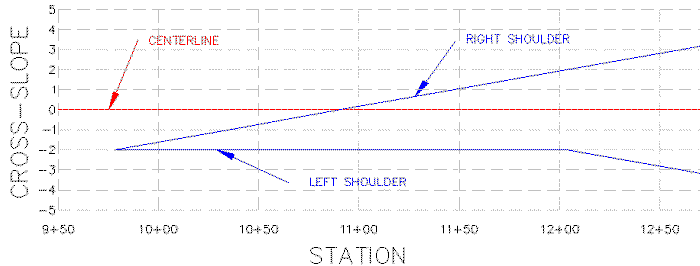
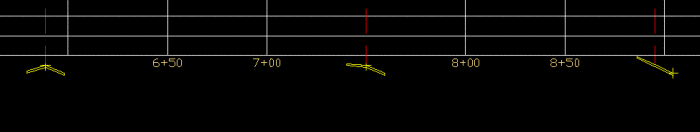
The Super Elevation Diagram is a graphical representation of the
change in cross-slope between the centerline and the left and right
shoulders of a roadway. The diagram is typically drawn on a grid,
similar to a profile, where the horizontal component represents the
stationing of the roadway and the vertical component shows the
cross-slope.
 Super Elevation
Diagram
Super Elevation
Diagram
 Draw Super Elevation
Diagram Dialog Box
Draw Super Elevation
Diagram Dialog Box
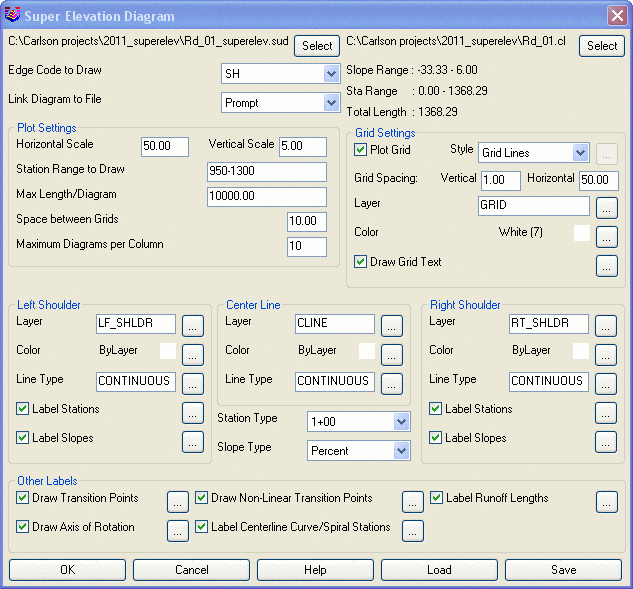
Select: Use this button (at the top-left of the
dialog) to browse to and select the Super Elevation Diagram file
(.sud) to be drawn.
Edge Code to Draw: Use this dropdown box to select
the Template ID to be represented in the Super Elevation
Diagram.
Link Diagram to File: This setting has 3 options:
Off, Prompt and
Auto:
Off: This option will
not re-draw the Diagram in the drawing if and when the Super
Elevation Diagram (.SUD) file changes.
Prompt: This option
will notify the user that the Super Elevation Diagram (.SUD) file
has changed and give the option of re-drawing the Diagram in the
drawing.
Auto: This option
automatically re-draws the Diagram when the Super Elevation Diagram
(.SUD) file changes.
Ref CL: Use the Select button to
associate the Super Elevation Diagram (.SUD) file with a Centerline
(.CL) file.
After the (.SUD) file has been selected, various
details about the file such as "Slope Range", "Station Range" and
"Total Length" are displayed below the Ref CL:
setting.
Plot Settings
Horizontal Scale: Set as needed.
Vertical Scale: Set as needed.
Station Range to Draw: Enter "ALL" to draw the
entire length of roadway or specify a range of stations.
Max Length/Diagram: Specify the maximum length of
each diagram. If the "Station Range to Draw" is longer than the
"Max Length/Diagram", additional diagrams will be stacked
vertically above the first.
Space Between Grids: If the total length of the
Diagram requires stacking of multiple Diagrams, this value
specifies the distance between Diagram Grids.
Maximum Diagrams per Column: When multiple
Diagrams are stacked, this number sets the maximum number of
Diagrams per Column. If this number is reached, a second column
will be created.
Grid Settings
Plot Grid: Select this option to have centerline
and shoulder diagrams drawn on a grid.
Style: Select the Grid Style from several options.
Grid Lines is the default setting. Other
options are:
Ticks Only: This setting
draws tick marks for both the station increments along the bottom
and the slope increments along the left edge of the diagram.
Ticks and Dots: This setting
draws tick marks for both the station increments along the bottom
and the slope increments along the left edge of the diagram and
draws a series of "dots" in a grid pattern across the rest of the
diagram.
Ticks and Checks: This
setting draws tick marks for both the station increments along the
bottom and the slope increments along the left edge of the diagram
and draws a series of "+"-signs in a grid pattern across the rest
of the diagram.
Grid Spacing: Set Vertical and Horizontal Grid
Spacing as needed.
Layer : Enter the name of the Layer for grid
lines, ticks, dots and checks or use the  button to select the Layer from a list.
Color: Enter the Color for grid lines, ticks, dots
and checks or use the button to select the Color from a
list.
Draw Grid Text: Select this option to draw Grid
Text for stationing and cross-slopes. Use the
button to specify Grid Text settings such as precision, text size
scaler, layer, text style, color and vertical/horizontal
spacing.
Left Shoulder & Right Shoulder Settings
Layer: Enter the name of the Layer for the Left or
Right Shoulder or use the button to select the Layer from a
list.
Color: Enter the Color for the Left or Right
Shoulder or use the button to select the Color from a
list.
Linetype: Enter the Linetype for the Left or Right
Shoulder or use the button to select the Linetype from a
list.
Label Stations: Select this option to label the
Station value at each slope change along the Left or Right
Shoulder. Use the button to specify Shoulder Station
Label settings such as precision, text size scaler, layer, text
style, color and prefix or suffix.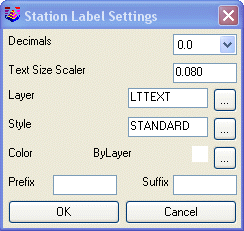 Left &
Right Shoulder: Station Label Settings
Left &
Right Shoulder: Station Label Settings
Label Slopes:
Select this option to label the Slopes along the Left or Right
Shoulder. Use the
button to specify Shoulder Slope
Label settings such as precision, text size scaler, layer, text
style, color and prefix or suffix. The user also has the option of
positioning the Slope label at the station of the Slope change or
along the transition line.
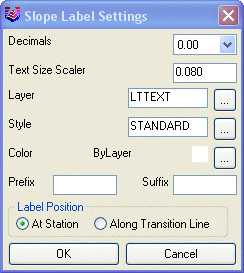
Left & Right Shoulder: Slope Label
Settings
Center Line Settings
Layer: Enter the name of the Layer for the
Centerline or use the button to select the Layer from a
list.
Color: Enter the Color for the Centerline or use
the button to select the Color from a
list.
Linetype: Enter the Linetype for the Centerline or
use the button to select the Linetype from a
list.
Station and Slope Type Settings
Station Type: Select the desired format for
Station. The options are: Percent or
Ft/Ft.
Slope Type: Select the desired format for Slope.
The options are: 1+00,
1+000 or
100..
Other Labels
Draw Transition
Points: Enable this option and use the
button to configure and format the
labels for
Transition Start,
Start Curve,
End of
Curve and
End of
Transition.
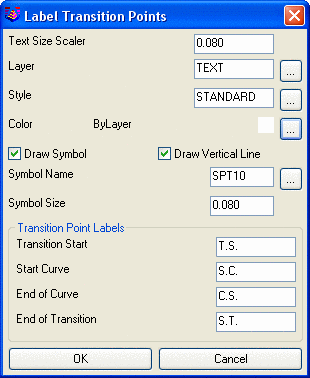
Label Transition Points
Dialog Box
Draw Axis of Rotation: Enable this option and use
the button to configure and format the
labels for the Axis of Rotation. The Axis
of Rotation is a small icon displayed at the bottom of the
grid at critical Super Elevation Points. The icon shows a
cross-section view of the pavement slopes and a "+"-sign indicating
the point of rotation for the Super Elevation.
 Axis of
Rotation
Axis of
Rotation
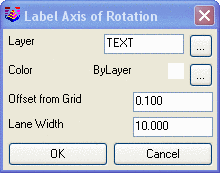 Label Axis of
Rotation Dialog Box
Label Axis of
Rotation Dialog Box
Draw Non-Linear Transition Points: Non-linear
transition points are drawn when the rate of change of elevation is
not constant at the point where the Super Elevation starts or ends.
Enable this option and use the button to configure and format
the labels for Start of Curve,
End of Curve and Point of
Intersection.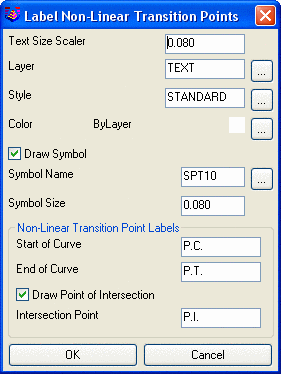
Label Non-Linear Transition
Points
Label Centerline Curve/Spiral Stations: Enable
this option and use the button to configure and format the
labels for Point of Curve,
Point of Tangent, Tangent to
Spiral, Spiral to Curve,
Curve to Spiral, Spiral to
Tangent and Spiral
Only.
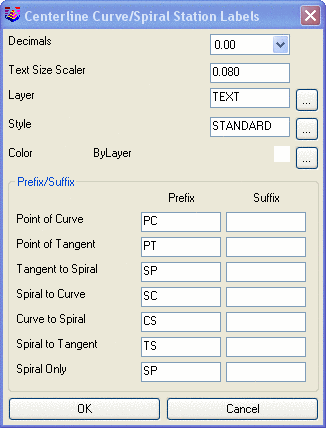 Label
Centerline Curve/Spiral Stations
Label
Centerline Curve/Spiral Stations
Label Runoff Lengths: Enable this option and use
the button to configure and format the
labels for Tangent Runout,
Super Elevation Runoff and
Full Super. These distances are displayed
as linear dimensions above the Diagram Grid.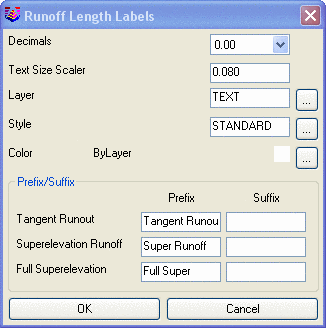
Label Runoff
Lengths
Pulldown Menu Location(s): Civil > Roads
Keyboard Command: drawsud
Prerequisite: Super Elevation Diagram file (.sud)