A culvert is a hydraulically short conduit, which can be used to convey stream flow underground through a roadway embankment or other flow obstructions, or used as an outlet structure attached to a detention pond. Culverts come in circular and rectangular cross sections, and concrete, corrugated steel, aluminum and plastic materials.
The hydraulics of a culvert are complex since several flow
control types may exist. The methods that Pipe Culvert Design uses
are from FHWA Hydraulic Design Series No. 5 (HDS-5), Hydraulic
Design of Highway Culverts. There are two flow controls: inlet
control and outlet control. Under Inlet Control, the
culvert's entrance characteristics determine it's capacity, and the
culvert is capable of conveying a greater discharge than the inlet
will accept. With Outlet Control, the inlet can accept more
flow than the culvert can carry because of the head loss due to the
friction along the barrel or the high tailwater elevation.
Furthermore, because culverts are generally not long enough to
achieve uniform flow, the flow profile inside is often gradually or
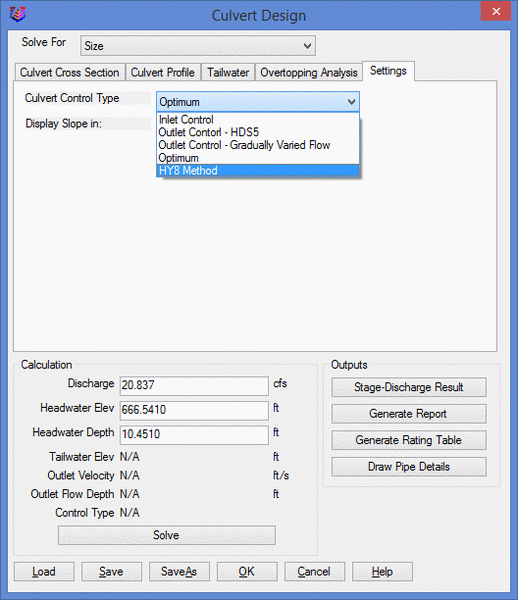
rapidly varied flow. In Pipe Culvert Design Settings tab, you may
specify the flow control type to design the culvert. If you choose
the Optimum option, both inlet control and outlet control
calculations are performed, along with the gradually varied flow
analysis. The worst-performing control condition is then used to
evaluate the proposed design, i.e. the greater of the inlet control
headwater and the outlet control headwater is the controlling
headwater. Please refer to HDS-5 for details.
Gradually Varied Flow occurs for free surface flow
conditions. This method computes water surface depth curve along
the length of the barrel and are developed in an upstream direction
by standard step method. In standard step analysis, the reach is
divided into a number of sub0reaches. Computations are performed in
steps from one section to the next, where the depth is incremented
or decremented to yield a correct energy balance in the basic
equation.
HY8 Method is introduced in Carlson 2018. One significant
difference in HY-8 is inlet control analysis. Carlson computes
inlet control headwater strictly by the inlet control questions
presented in HDS-5. HY-8 uses polynomial curve fits for inlet
control headwater computation.
From the Structure menu in the Hydrology Module, choose Pipe
Culvert Design to display the design dialog. Click on Load button
to load an existing culvert file to view or modify it, or a new
file to start a fresh design. From the Solve For list, select the
value that you want to calculate. The available values are:
Discharge, Headwater and Size. You may choose Size/Discharge or
Size/Headwater to compute the exact discharge or headwater values
after the size has been solved.
Under the Settings tab, Control Type is used to calculate
culvert flow as described above. Users can also set Slope display
format in either ft/ft or percentage.
 |
| Culvert Cross Section |

|
| Culvert Profile |

|
| Tailwater |

|
| Overtopping Analysis |
In the Discharge box, enter the flow rate in the culvert.
In the Headwater Elev box, enter the water surface elevation at the
upstream end of the culvert. You can also enter the Headwater Depth
then the program will add the depth value to the inlet invert to
get the headwater elevation. If you are solving for either
discharge or headwater, the corresponding box will be disabled.
Section Size Library allows you to specify as many as available
pipe sizes for solving for culvert size. After the hydraulic
calculation, the smallest, large enough, available pipe size will
be chosen. Please refer to the Pipe Size Library command for
defining pipe sizes.
Click on Solve button, depending on Solve For selection, the discharge, headwater elevation, culvert size and the tailwater elevation are calculated and displayed in the dialog correspondingly. The Outlet Velocity and Flow Depth are calculated and shown, and the Control Type is also illustrated.
Click on the Stage-Discharge Result button to display the stage-discharge curve in the Stage-Discharge Result Dialog. From this dialog, you can view the stage-discharge curve, write the result to a stage-discharge file(.STG), and draw the graph into the CAD graphic. When you click on the Draw button, the Stage-Discharge Curve Settings dialog displays from where you can define how to plot the text and graph on screen.
 |
| Stage-Discharge Limits |
 |
| Stage-Discharge Dialog |
Click on Generate Report button, the program will present a report screen that contains detailed information regarding the design parameters and the calculations. The report window provides the options of printing, drawing the report in AutoCAD or storing the report to a file. Shown below is an example.
 |
| Culvert Report |
A rating table presents the discharge-headwater relationship in the tabular form. It can be displayed in a Microsoft spreadsheet or a standard report. Click on Generate Rating Table button to open Rating Limits dialog. In the Variant list, select the independent variable. The available variables are Discharge and Headwater. Enter data in the Minimum, Maximum and Increment boxes. Enter the Tailwater Elev and select the decimal setting from the Decimals list. When you finish entering data, click on OK button to calculate the rating table. A rating table example is shown below in the standard report format. The first column Discharge is an independent variable, and the other columns are computed variables.
 |
| Culvert Rating Table
Limits |
 |
| Culvert Rating Table in Report
Format |
Draw Pipe Detail button plots a fully annotated standard detail, with user-controlled inlet and outlet slope entries and scaling.
 |
| Draw Pipe Detail Settings |
Pulldown Menu Location: Structure
Keyboard Command: culvert
Prerequisite: a culvert file