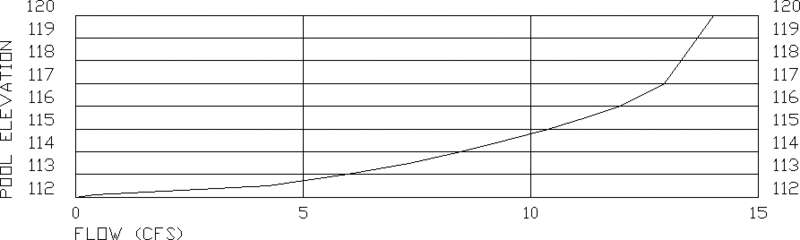
This program draws a stage-discharge graph with the stage (water elevation) on the Y-axis and the discharge on the X-axis. The data to graph is read from a stage-discharge (.stg) file which can be created by several routines including Design Channel, Drop Spillway, etc.
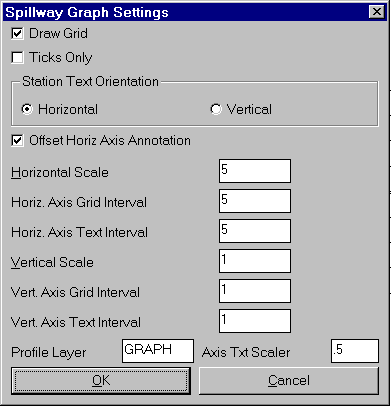
First you are prompted to select a STG file to draw. Then the program asks for the ending discharge for the graph which defaults to the highest discharge in the file. Next this dialog is displayed to enter the graph scale and intervals. The height of the annotation equals the horizontal scale times the Axis Text Scaler.