Rainfall is the source of the ground runoff. Along with the watershed conditions, the rainfall that neither infiltrates nor gets trapped in low areas and depressions contributes to the direct surface runoff, upon which the storm drainage system design is based.
The Rational Rainfall Library use IDF curves to provide average
rainfall intensity data for particular storm events. With a known
rainfall duration and frequency, an intensity is calculated via the
IDF curve and applied to the Rational Method to obtain the peak
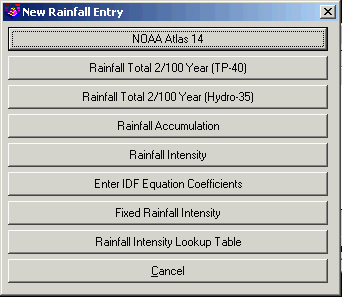
flow for designing the sewer network. There are six methods to
input rainfall data: TP-40 rainfall map, Hydro-35 rainfall map,
rainfall accumulation, rainfall intensity, IDF equation
coefficients and fixed rainfall intensity. Rainfall maps provided
by government organizations are practical rainfall data resources
for engineering design. TP-40 maps show precipitation depths in the
US for storm durations from 1 hour to 24 hours and for recurrence
intervals from 1 to 100 year. Hydro-35 maps are for the central and
eastern US, and provide rainfall data for durations as short as 5
minutes. Please refer to HEC-12 for details on methodology for
computing IDF curves from rainmaps. In addition to TP-40 and
Hydro-35 method, you can input rainfall accumulations or
intensities at various storm durations to define IDF curves. If you
already have the IDF equation coefficients calculated, you can
enter the coefficients directly to define the IDF curves. The IDF
curves are interpolated linearly between the data points. If you
choose to use fixed rainfall intensity, no IDF curve is calculated
and this value is used directly. You may also input rainfall
intensity data with lookup table method, where IDF curve is not
used, rainfall intensity will be interpolated linearly from the
lookup table.
The IDF equation for a given return period is defined as
follows. The coefficients A, B and M are calculated by log-log
regression of the rainfall intensity and (t + B).
I = A / (t + B)M
where: I = rainfall intensity (in/hr, or mm/hr in
metric)
A, B, M =
equation coefficients for a given return period
t =
rainfall duration (min.)
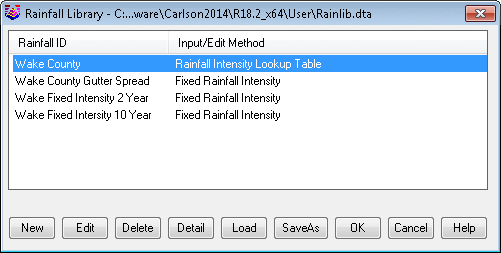
The Rainfall Library stores rainfall data in a library file under the ...\USER folder and is available for all projects. From the Network > Sewer Network Libraries menu in the Hydrology Module, select the Rainfall Library to open the library dialog to edit rainfall data. The dialog lists all rainfall entries by their ID and their input/edit method. New button creates a new rainfall through one of the seven methods: TP-40, Hydro-35, Rainfall Accumulation, Rainfall Intensity, Enter IDF Equation Coefficients, Fixed Rainfall Intensities, and Rainfall Intensity Lookup Table . Edit button allows you to modify an existing rainfall, and the Delete button removes the highlighted rainfall from the library. Load and SaveAs buttons allow you to load and save the rainfall data.
|
|
| Rainfall Library Dialog |
|
|
| New Rainfall Dialog |
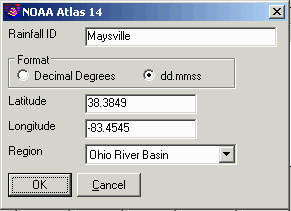
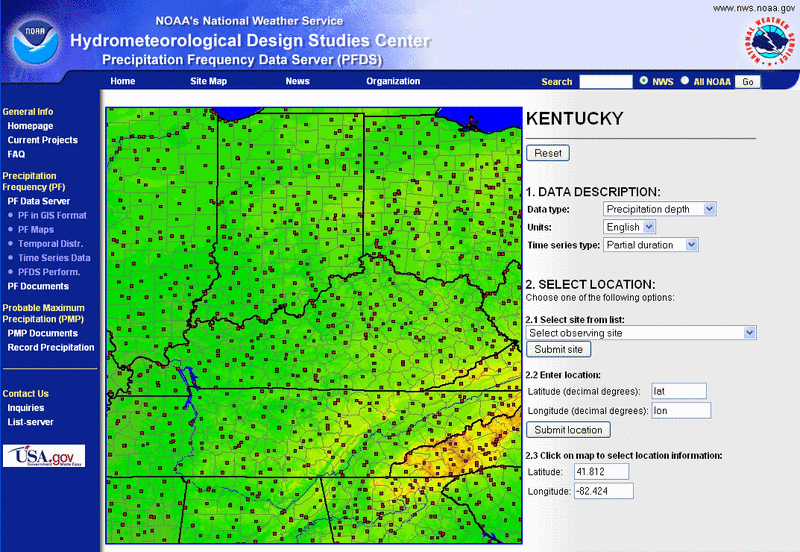
This method fills out the rainfall intensity values using the
NOAA Atlas 14 rainfall models. In the dialog, enter a name and
lat/lon for your location and choose the NOAA Atlas 14 region. The
first time that you run a region, the program downloads the
rainfall models to your computer.
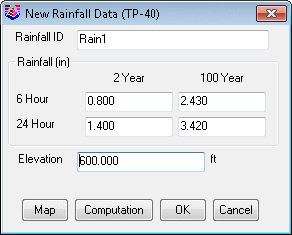
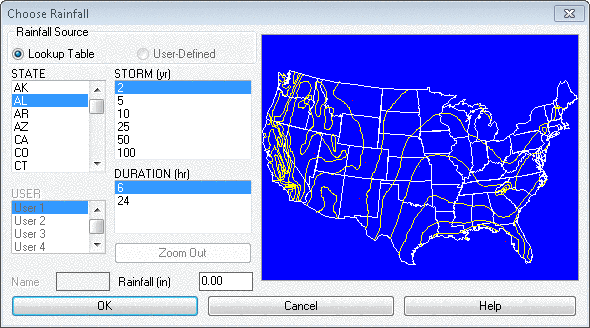
The TP-40 method is used to define IDF curves for the Western states in the US. It requires rainfall accumulations of 6-hour and 24-hour storm durations for the 2-year and 100-year storms, and the elevation of the location. In the TP-40 dialog, type the rainfall name in the Rainfall ID box. The rainfall depth can be entered either manually or from the TP-40 maps. Click on Map button to open the rainfall map, pick a state on the map to zoom in to the state map, and then pick a location to get the rainfall depth of 6-hour and 24-hour duration for 2-year, 5-year, 10-year, 25-year, 50-year and 100-year storm events. In the Elevation box, enter the surface elevation at the design location. Computation button computes the rainfall intensities and the IDF coefficients, and displays the result in the Rainfall Intensity dialog. Click on OK button to commit the rainfall entry.
|
| TP-40 Rainfall Data
Dialog |
|
| TP-40 Rainfall Map |
|
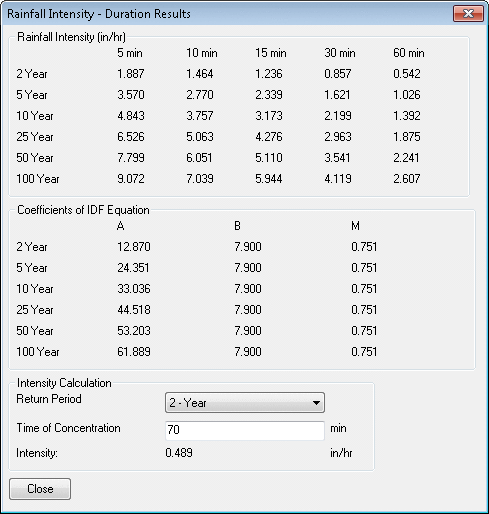
| Rainfall Intensity
Results |
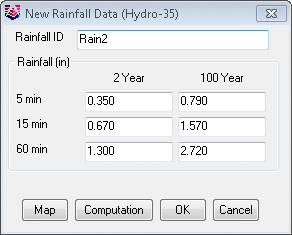
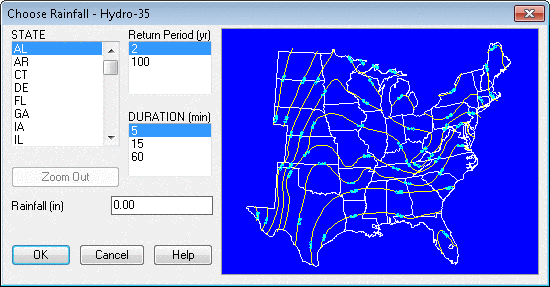
The Hydro-35 method is used to define IDF curves for the Central and Eastern states in the US. It requires rainfall accumulations of 5-min, 15-min and 60-min storm durations for the 2-year and 100-year storms. In the Hydro-35 dialog, type the rainfall name in the Rainfall ID box. The rainfall depth can be entered either manually or from the Hydro-35 maps. Click on Map button to open the rainfall map, pick a state on the map to zoom in to the state map, and then pick a location to get the rainfall depth. Computation button computes the rainfall intensities and the IDF coefficients at 2-year, 5-year, 10-year, 25-year, 50-year and 100-year return periods, and displays the result in the Rainfall Intensity dialog. Click on OK button to commit the rainfall entry.
|
| Hydro-35 Rainfall Data |
|
| Hydro-35 Rainfall Map |
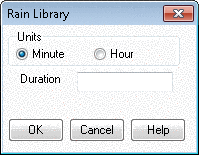
This method allows you to enter the rainfall accumulations of various durations for any of 1-year, 2-year, 5-year, 10-year, 25-year, 50-year, 100-year, and a User-Defined return periods for computing the IDF curves. The Reset Return Period button allow the user to add or remove Return Periods as needed. Add a Duration button adds new duration entry to the spreadsheet. For accuracy, three or more durations are required. Delete a Duration button deletes the highlighted duration entry. Computation button computes the rainfall intensities and the IDF coefficients, and displays the result in the Rainfall Intensity dialog. The Import CSV button allows you to import the rainfall depth values in a comma separated values text file. In the CSV file, the first column is the duration value in minutes, the rest columns are rainfall depths associated to the chosen return periods. Click on OK button to commit the rainfall entry.
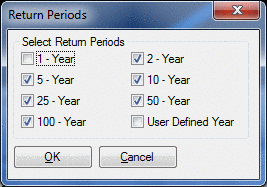 |
| Return Periods Dialog |
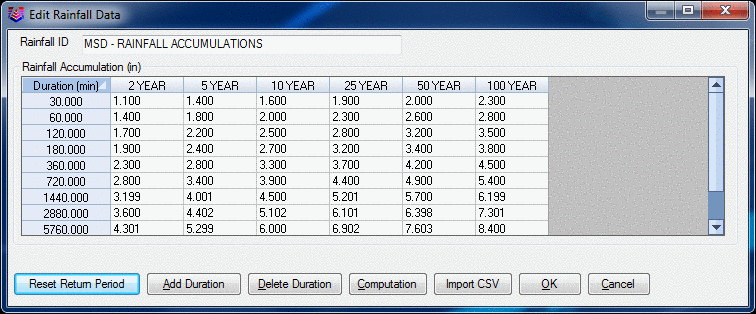 |
| Customed Rainfall
Accumulations |
|
| New Duration Entry |
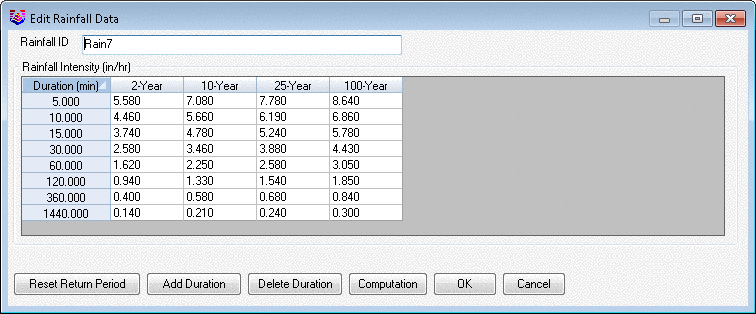
This method allows you to enter the rainfall intensities of various durations for any of 1-year, 2-year, 5-year, 10-year, 25-year, 50-year 100-year, and User Defined return periods for computing the IDF curves. The Reset Return Period button allow the user to add or remove Return Periods as needed. Add a Duration button adds new duration entry to the spreadsheet. For accuracy, three or more durations are required. Delete a Duration button deletes the highlighted duration entry. Computation button computes the rainfall intensities and the IDF coefficients, and displays the result in the Rainfall Intensity dialog. The Import CSV button allows you to import the rainfall intensity values in a comma separated values text file. In the CSV file, the first column is the duration value in minutes, the rest columns are rainfall intensities associated to the chosen return periods. Click on OK button to commit the rainfall entry.
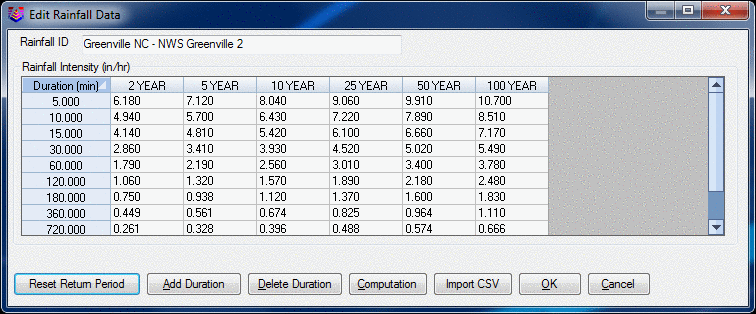 |
| Customed Rainfall
Intensities |
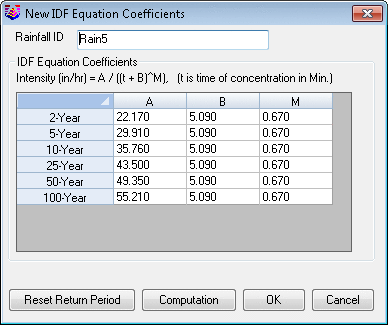
When you have the coefficients calculated, you can use this method to enter the coefficients to obtain the actual IDF curve equation. In the following spreadsheet dialog, enter the known coefficients A, B and M to create the IDF equation. Computation button computes the rainfall intensities and displays the result in the Rainfall Intensity dialog. Click on OK button to commit the rainfall entry.
|
| IDF Equation Coefficients |
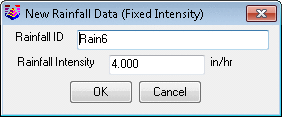
The method creates a rainfall entry with the fixed rainfall
intensity. When you choose to use this storm event, this fixed
intensity will be used in your hydrology calculation
directly.
|
| Fixed Rainfall Intensity |
|
|
Rainfall Intensity Lookup Table |
|
|
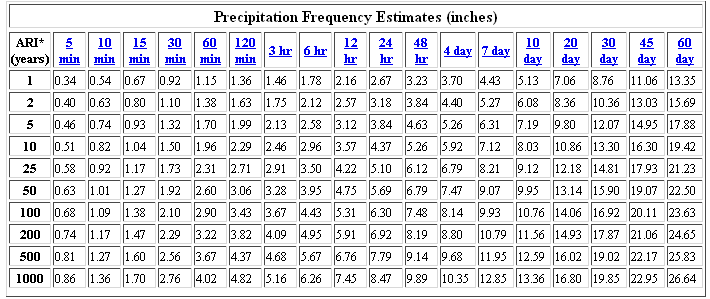
| Point
Precipitation Frequency Estimates From NOAA Atlas 14 |