

This command plots the Intensity-Duration-Frequency curves for the rainfall associated with the current sewer network. From the Network menu in the Hydrology Module, choose Draw IDF Curve. On the top of the dialog, the sewer network file name and the rainfall ID are shown. The Library button allows you to specify other rainfall data from the rainfall library. In the Return Period list, select one or more return periods. Select the Display Duration in either Hour or Minute, and enter the values in the Duration and Duration Interval boxes. Click on OK button to plot. The Draw IDF Settings dialog allows you to specify how to plot IDF curves on screen.
|
|
| Draw IDF Curves |
|
|
| Draw IDF Settings |
|
|
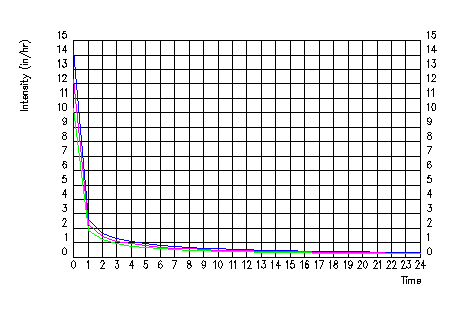
| IDF Curve Example |
Draw IDF Curve dialog: Fill in values.
Pulldown Menu Location: Network > Draw IDF Curve
Keyboard Command: drwidf
Prerequisite: a sewer file (.SEW),
...\USER\RainLib.dta