Fence Diagram
Fence Diagram produces a profile of the surface and strata along
the selected baseline polyline--a geological cross-section. This
command is somewhat similar to the command Profile from Surface
Model. Fence diagrams are a good way to verify that the geological
model is correct-especially when the drillholes are plotted on them
with Draw Geologic Column option. The first step is to draw a
baseline polyline in plan view from which the fence diagram is
created. This polyline can have more than two points and can either
go to drillholes or between them. The Fence Diagram can either be
drawn on a 2D grid off to the side, or in 3D, and rotated around in
3D. Fence Diagram derives the strata profiles by either gridding, a
Geologic Model file, or intersection method. There are many options
for scale, hatching and labeling. They are explained separately
below.
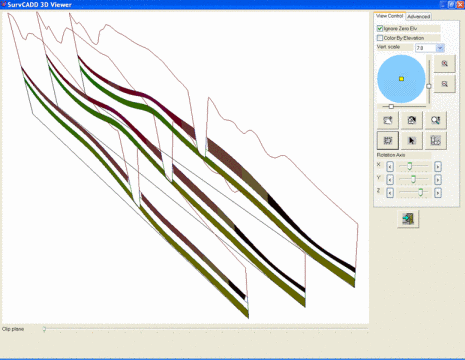
- Draw Fence Diagram: In Real
World Coordinates or On a 2-D Grid: There are two options
for choosing the location of the fence diagram. It can be drawn in
real world coordinates in 3D, directly below the fence line drawn
in plan view. It will have to be rotated on the X axis and spun
around on the Z axis to see it. The other option is to draw it off
to the side at a user defined spot, in a 2D grid. Similar to the
command Draw Profile. Shown here are 3 Fence Diagrams drawn in Real
World Coordinates, hatched by strata attribute.
- Ignore Zero Elevations:
When using the Grids from Drillholes or Intersection methods, the
surface topo will be modeled by anything on screen. Selecting this
will ignore anything that has an elevation. This is recommended
unless the mine is near sea-level.
- Fence Extraction
Method: The Grids from Drillholes method creates a grid
model of each strata found in the drillholes "on-the-fly". The
program will prompt for the modeling method to use (ie
Triangulation or Inverse Distance). These modeling methods are
described in the command Make Strata Grid Files for more details.
The Geologic Model option will use a file that contains grids and
seam names. The Geologic Model is made under Drillhole-Define
Geologic Model. The Intersection method triangulates the drillholes
and then finds the intersection of the triangulation mesh and the
polyline. In order to obtain data for the strata with the
intersection method, the polyline must have at least one drillhole
on each side. It is the only way to see a fault in a fence diagram
when using the drillholes. Grids from Drillholes does not honor
fault lines.
- Process Multiple Named Fence
Polylines: This option allows you to draw multiple fence
diagrams at the same time. The diagrams are stacked vertically.
Instead of picking a single fence alignment polyline, you can
selected multiple polylines that have been tagged as fence
polylines using the Tag Fence Polylines command. Each of the fence
diagrams is labeled with the fence name assigned to the tagged
fence polylines.
- Vertical Spacer Between
Diagrams: This controls the spacing between the multiple
fence diagrams when draw more than one at a time.
- Prompt for Additional Surface
to Draw: This setting will allow for selecting another
surface file to draw on the fence diagram. An example could be an
open pit with benches design that will be drawn on top of the
geology, all at the same time. Up to 10 additional surfaces can be
drawn and each one has a separate layer name setting. The program
prompts for these surface file names and layers in a separate
dialog after picking OK on the main Fence Diagram dialog.
- Use Specific Strata
Definitions: This option
will allow for selecting a different Defined Strata file than the
one that is set current. Use this option and select a different SDF
file for layering, colors and hatching.
- Horizontal Scale: This
is the horizontal scale that will be used to draw the fence
diagram. It usually matches the horizontal scale of the
drawing.
- Vertical Scale: This is
the vertical scale that will be used to draw the fence diagram. It
usually matches the vertical scale of the drawing. If it is the
same as the horizontal scale, the fence will be drawn at a 1:1,
with no vertical exaggeration. To get a 2X vertical exaggeration,
the vertical scale must be 1/2 of the horizontal scale such as
50H/25V. The same drawing distance represents 50 horizontally and
25 vertically. So it must be twice as tall vertically to equal
50.
- Horizontal Axis Grid
Interval: This is how often a grid line and tick mark will
appear horizontally along the X-axis.
- Vertical Axis Grid
Interval: This is how often a grid line and tick mark will
appear vertically along the Y-axis.
- Horizontal Axis Text
Interval: This is how often a text label will be drawn on
the fence diagram axis. It does not have to match the Grid
Interval, but it can.
- Vertical Axis Text
Interval: This is how often a text label will be drawn on
the fence diagram axis. It does not have to match the Grid
Interval, but it can.
- Draw Plan View: The
Draw Plan View option will graph the drillhole locations above the
fence diagram. For this graph, each drillhole is projected onto the
baseline polyline to find the station and offset of the
drillhole.
- Plan Vertical Scale:
This is the scale factor for the Plan View drawn above the fence
diagram. It is separate, so that the text and drillholes drawn can
be different then the fence diagram scale settings if
desired.
- Draw Surface Polyline:
This option will draw a new polyline along the surface of the fence
diagram. It is required if the fence diagram has a pit in it. The
surface polyline will not be continuous across the entire fence if
there is a pit, as it is broken by outcropping seams. Routines such
as Cut and Place run on Fence Diagrams require the surface polyline
extends across the pit, so it has a place to spoil. The other,
broken surface polylines can be erased if the continuous one is
used.
- Grid Settings:
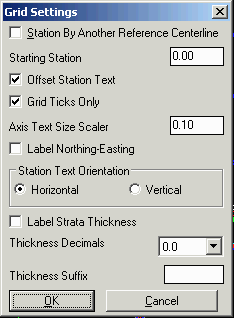
- Station By Another Reference
Centerline: This option will station the horizontal X-axis
by a predefined centerline CL file. The centerline file will be
prompted for during the routine.
- Starting Station: This
is the station that is labeled at the beginning of the fence
diagram horizontal X-axis grid. By default it is set to 0.
- Offset Station Text: Offsets the station labels below
the horizontal axis of the grid.
- Grid Ticks Only: This
option will just draw tick marks at the set grid interval for both
horizontal and vertical axis.
- Axis Text Size Scaler:
This is the scaler that is multiplied by the horizontal scale to
determine the text size. It applies to both the X and Y
axis.
- Station Text Orientation: Controls the rotation of the
station labels on the horizontal axis.
- Label Strata Thickness: Dimensions the strata thickness
using the Thickness Decimals and Suffix.
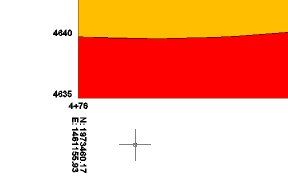
- Label Northing-Easting:
This option labels the Northing and Easting coordinates along the
bottom of the fence diagram at every vertice on the fence line that
is drawn in plan view. An example is shown below.
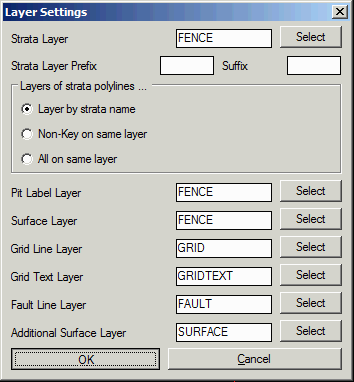
- Layer Settings: Layers
of fence diagram polylines contains 3 options for drawing the
polylines layers. The first one, Layer by Strata Name, will
create a layer for each strata name found in the drillholes or
Geologic Model. There are settings for a prefix and suffix to add
to the strata name for the layers. The second option, NonKey on
Same Layer, will draw the Key strata and layerize them by strata
name. All of the NonKey strata will be drawn on the Fence layer, or
any user defined layer in the dialog box. The last option,
All on Same Layer, will draw all the polylines on the defined layer
"Fence" that appears in the dialog, or any user defined
layer. There are separate layers for the Pit Label, Surface
Polyline, Fault Line, Additional Surface, Grid Lines and Grid Text
layers.
- Label Pit Lines: When
the Label Pit Polylines option is on, the program will prompt you
to select polylines with attached pit/site names. These pit names
will be labeled with a vertical line and labeled along the bottom
of the fence diagram grid at the position where the fence plan view
polyline crosses the pit polylines. This option is useful for
dragline design commands such as Cut and Place. When set to Tick
Mark, the vertical line is a fixed height. When set to Bottom
Strata, the vertical line goes from the grid bottom to the bottom
strata line.
- Draw Geologic Columns:
This option will use the Geologic Column command to draw drillholes
directly on the Fence Diagram. If a drillhole is at an angle, the
fence diagram will show the geologic column at the angle projected
onto the fence polyline.
- Max Offset: This is the
search distance from the polyline that the drillholes will be used
for drawing on the fence. Any drillhole further than this distance
from the polyline will not be drawn.
- Settings (Draw Geologic
Columns): This button brings up the Draw Geologic Columns
window where all of the settings may be modified.
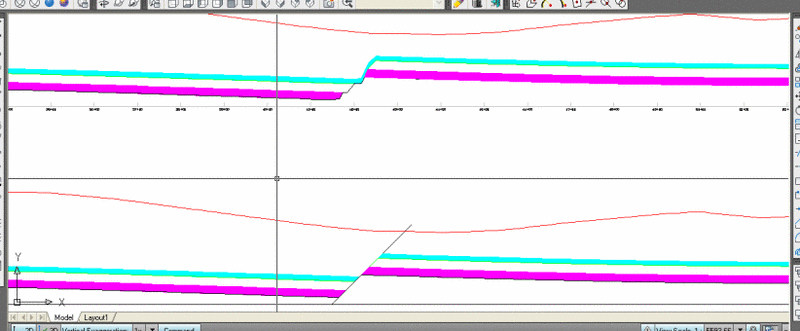
- Draw Faults: This
option will draw the fault line on the fence diagram cross section
in the place and at the angle that it crosses the cross section. It
draws it just as a polyline on top of the fence diagram. The seams
should be faulted already, this is just a graphic representation of
the placement and angle of the fault. The buffer offset is a way to
clean up the seams in the area of the fault. The program offsets
the fault line in fence view left and right by this amount. Then it
trims the strata lines at this offset. Then it projects the trimmed
strata lines onto the original fault line. The purpose is to trim
out the transition zone area of the strata. Typically, this area
size is about the same as the grid cell size of the strata model.
So a good buffer offset size is to use the grid cell size. Shown
here are the grids without the fault drawn on it, cleaning up the
grids, and also with the 45 degree fault drawn. Notice the large
difference in how the fence is displayed with the Draw Faults
on.
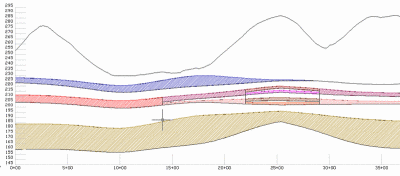
- Hatch Fence: Turn this option on to hatch the strata in
the fence, otherwise leave it off to just draw polylines. The
strata hatch patterns are defined in the Define Strata command. If
this is selected, then the hatch patterns defined there will be
used. If a strata exists that is not defined, it will use the
default hatch in Pattern Name.
- Pattern: The default
hatch pattern is used if there is no pattern defined for that
strata. This can be MDST or SOLID, for example.
- Select Pattern (Hatch):
Selecting this button brings up the pages of geological hatch
patterns to choose from.
- Scaler: This is the
scale factor that is applied to the hatch pattern in the Fence
diagram. A factor of 1.00 here will use the default hatch pattern
scale factor set with Drawing Setup.
- Rotate: The Rotate
option for hatching rotates the hatch pattern to best fit the angle
of the strata. A hatch pattern can have only one rotation, so
rotating will not be effective for a strata with multiple
rotations. There is also the Azimuth option in the Define Strata
command to rotate the hatch.
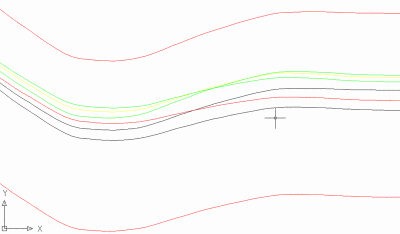
- Clip Intersecting
Strata: This option is useful to check for crossing grid
files. It is ON by default. Turning the option off will draw the
polylines as they are in the grids or modeled from the drillholes.
It is only active if the hatch option is turned off, and the fence
is just drawn as polylines. Shown below is an example of the
crossing polylines in a Fence Diagram. This means the grids or
modeling might be suspect and should be cleaned up.
- Draw Key Strata Only:
This option will draw and hatch just the Key strata on the fence
diagram. The Non-Key intervals found in between the Key will be
left as empty gaps.
- Max Drillhole Offset from
Line: A maximum distance offset from the baseline polyline
can be specified to filter out drillholes beyond the area of
interest.
- Hatch Key Strata
Only: This option will just hatch inside the Key
strata that are drawn. The NonKey strata will be just polylines,
with no hatch inside. Shown here is an example that has just the
Key strata hatched, but also the limit lines are used to define the
breaks between the splitting seams. Notice the nice, vertical
contact from a full seam to a split seam.
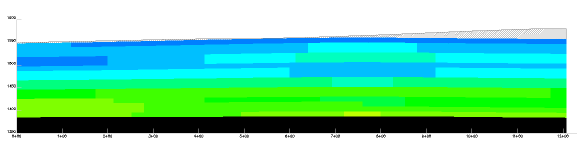
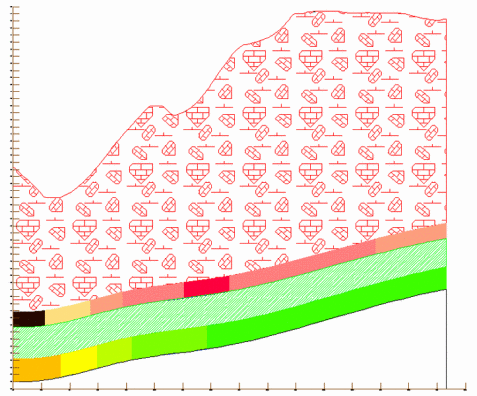
- Hatch By Block Model:
This option will hatch the seams using the GPF Grade Parameter File
and the Block Model BLK files. A legend of the grades can be drawn
also in the Define Grade Parameter screen. This is a great option
to use to show the changing quality not only horizontally, but also
vertically in the geology.
- Hatch By Strata
Attribute: This option is similar to Hatch by Block Model,
except there is no Grade Parameter File required. It will look at
look at the quality attributes found in the Geologic Model, or in
the drillholes, and bring up a list. Select an attribute to hatch
by. Then a color palette will appear, allowing to set the colors
and ranges of the different "zones". This will just change the
hatch horizontally across the strata, not vertically as the Block
Model does. Shown below is an example of coal seams colored by
BTU.
- Draw Legend: Use the
Draw Legend option to make a legend of the strata hatch patterns
and colors. There will be a prompt to pick the location to draw the
legend.
- Legend Scale: This is
the scale factor to size the legend.
- Bottom Hatch Scaler:
This is the scale factor to use for the strata that appears at the
very bottom of the fence diagram. If using a solid, then no scale
is applied, but any other hatch pattern will use a scale
factor.
- Auto Scale Hatch
Pattern: This option will auto fit the hatching inside the
strata perimeters.
- Load/Save: All of the
switches and settings can be saved and loaded with these buttons.
It creates a FEN file containing all of the settings.
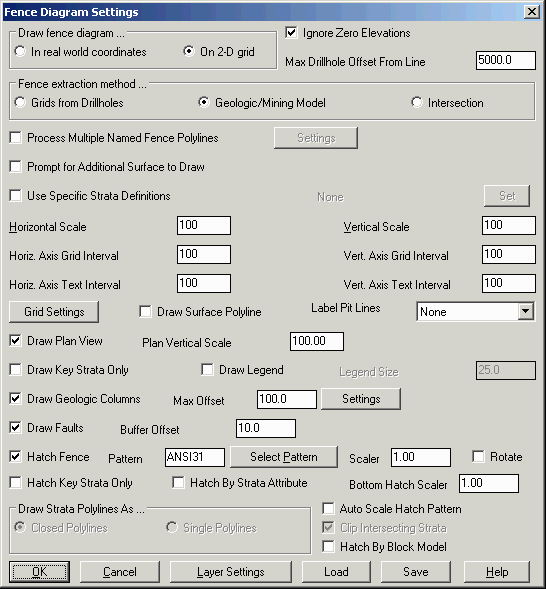
Prompts
Fence Diagram Settings dialog box
Select polyline to pull fence diagram from: pick the
polyline
Select surface entities & at least 3 drillholes.
Select objects: Select the drillhole symbols and surface
entities. Surface entities can include points, lines, and
polylines.
Reading points ... 139
Reading drillholes ...
Choose modeling method (<Triangulation>/Inverse
dist/Kriging/Polynomial/LeastSq)? Press Enter
Bottom elevation of grid <1600.00>: press Enter to accept default
Top elevation of grid <2000.00>: press Enter to accept default
Pick the lower left corner for the fence diagram: pick a
point in a clear area of the drawing
Pulldown Menu Location: StrataCalc
Keyboard Command: fence
Prerequisite: Drillholes or Geologic Model, and a fence
alignment polyline