This command takes the selected drillholes and calculates the
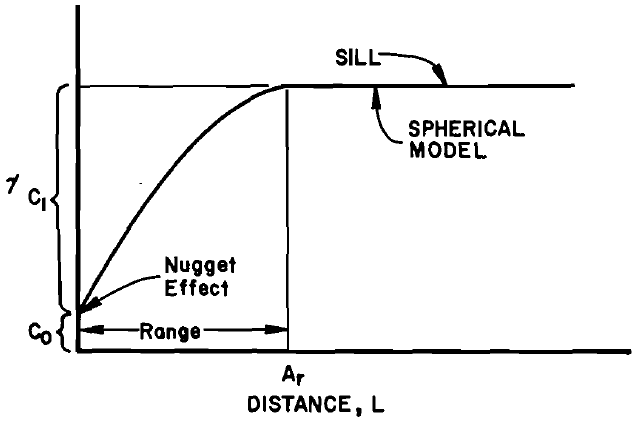
variogram data, outputting the Nugget, Sill and Range. These
parameters are entered into the Carlson Kriging dialogs for
gridding and block modeling. Variograms may be 2D or 3D. When the
command is first activated, you will be prompted to select the
variogram type, as shown below.

After selecting the variogram type, you will be prompted to
select the drillholes, channel samples, and strata polylines to use
for variogram calculation. You will then be prompted to select a
strata to process, as shown below.


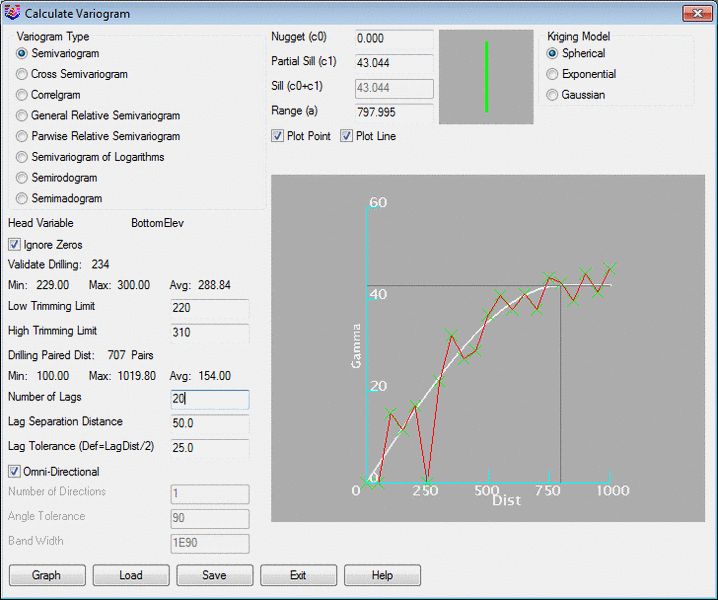
The 2D variogram window is shown below.


Variogram Type:
The type of variogram to calculate is shown in the upper left
corner. First, select the Head Variable in the pull-down. Then
select the type, such as Semivariogram. This should then
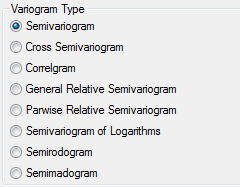
display the head variables span from low to high. The current types
of variograms to choose from is shown below. Details of each method
can be found online at kriging websites such as Isobel Clark's
www.kriging.com.

Variogram
Attributes:

Fitting:
Omnidirectional: Click Exponential option beside big circle on the
right to begin. Left click left mouse and drag on the plot to set
Range, Sill and Nugget or enter them in the boxes to update the
curve. To move the Nugget, left click on the far left side, at the
beginning of the curve.

Directional Trend: The variogram plots redraw by clicking on the
lines on the large directional window at the top, with the green
line, so the 4 angles would be: 0 Azimuth, 135 Azimuth, 90 azimuth
and 45 azimuth. The resulting values are displayed above for
geostatistical modeling.
The 3D variogram is shown below.

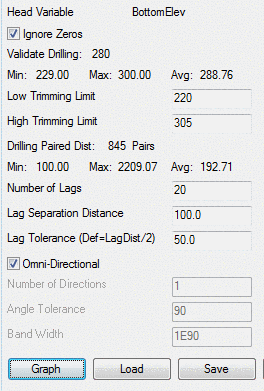
Low Trimming Limit: This value sets the minimum attribute
value to consider for the variogram.
Maximum Trimming Limit: This value sets the maximum
attribute value to consider for the variogram.
Spatial Analysis: This button will scan the sample data and
generate recommended values for the variogram calculation.
Command: Select drillholes,
channel samples and strata polylines.
Select objects: Specify opposite corner: 177 found
Select objects:
Reading drillhole 176
Finding splits ...
Pulldown Menu Location:
StrataCalc
Keyboard Command:
vgramrun