
Draw Settings
This section of the help document discusses the
Draw Settings, shown below.

As the name suggests, this command draws geologic columns for the selected drillholes in both 2D and 3D. All of these settings may be saved to a geologic column settings file (.gcl). Each option is described below. Notice that the dialog is divided into three sections: 1) Draw Settings, 2) Label Settings, and 3) Layer and Color Setttings.
Draw...: The geologic
columns can be drawn In 3D, On 2D Grid or
Next to Drillhole.
The In 3D option will draw the columns in true 3D space.
The On 2D Grid option will
draw a cross-sectional view of the columns in a user defined
location.
The Next to Drillhole option will draw a cross-sectional
view of the columns next to the true drillhole locations.
3D Options: This button is only active when the Draw
in 3D option is selected. These options control how the
drillhole will be drawn in 3D space. When selected, the below
dialog will appear.

Column Format: This option controls how the column will be drawn.
The Cylinder option will draw the column as 3D faces.
The Rectangle option will draw the column as 3D polylines.
The Line option will draw a single 3D polyline to represent each column. An example of each option is shown below as viewed in the 3D Viewer Window.

Vertical Exaggeration From...: This option controls how 3D columns will be drawn when vertical exaggeration is applied.
When the Base Elevation options is used, the column will be scaled, but the Base Elevation value (entered immediately below this option) will be held at the true elevation, even if the column does not intersect this elevation.
When the Surface option is used, the column will be scaled, but the top of the hole will be held at the true elevation.
For example, consider a drillhole with a collar elevation of 100 and a bottom elevation of 60 to be drawn with a 2X vertical exaggeration. If the Surface option is used, the top of the column will be drawn at elevation 100 and the bottom of the column will be drawn at elevation 20. If the Base Elevation option is used with a Base Elevation of 0, the top of the hole will be drawn at elevation 200 and the bottom of the hole will be drawn at elevation 120.
Rotate Labels Vertical: When selected, this option will draw all 3D text labels oriented in the vertical direction. When this option is not selected, 3D text labels will be oriented in plan view.
Align Horiz by...: This
option is only available when the Draw on 2D grid option is
selected. Three methods are available for Horizontal Alignment.
The Individual option will prompt you to select the location
to draw each individual column. With this option, no elevation vs.
station grid will be drawn, as the columns are completely dependent
on the locations selected.
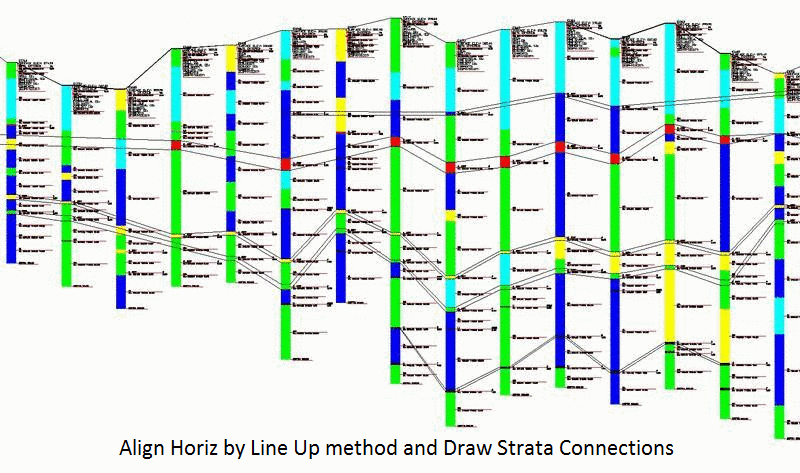
The Line Up option will space the columns equal distances
apart from one another, regardless of the true distance between the
holes. The space between the columns is the product of the Space
Scaler multiplied by the Horizontal Scale.
The Projected option will draw the columns by projecting
them onto a cross-sectional alignment polyline.
Both the Line Up and Projected options require that
an alignment polyline be drawn through or near the columns of
interest prior to the command. After clicking OK on the main
dialog, you will be prompted to select this polyline, as well as
the "maximum drillhole distance from alignment polyline" to filter
out distant holes. Any drillholes outside of this range will not be
drawn, even if they are explicitly selected.
Draw on Fence Diagram:
This option is only available
when the Align Horiz by Projected option is selected. This
option will draw the drillholes on a pre-existing fence diagram.
When this option is selected, you will be prompted to select the
bottom left corner of the Fence Diagram and enter the bottom
elevation of the diagram. This will draw the columns on the
diagram. This is useful to show the level of agreement between the
drillholes and the strata grids generated from the
drillholes.
Vertical Scale:
This value, relative to the
Horizontal Scale, determines the vertical exaggeration. For
example, a Horizontal Scale of 50 and a Vertical Scale of 10 will
produce a 5X vertical exaggeration.
Draw To Sheets:
This option is only available if
the Align Horiz by Individual option is selected. This will
draw the individual drillholes on multiple sheets, breaking the
page as necessary.
Draw CESO Sheets:
This option is similar to the
Draw to Sheets option, but is formatted specifically for a
particular Carlson user. Unlike the Draw to Sheets option, this
option will add header information to the sheets.
Column Width Scaler: This value, relative to the Horizontal Scale, determines the width of the geologic column. For example, a Column Width Scaler of 0.15 and a Horizontal Scale of 100 will produce a column with a width of 15 drawing units.
Text Size Scaler:
This value, relative to the
Horizontal Scale, determines the text height of the labels. For
example, a Text Size Scaler of 0.15 and a Horizontal Scale of 100
will produce text labels with a height of 15 drawing
units.
Hatch Scaler:
This value is only used when the
Fill by Hatch option is selected. This value, relative to
the hatch scales in the current Strata Definition File, determines
the hatch scale of each strata's hatch pattern. For example, a
Hatch Scaler of 5 and a strata with a defined hatch scale of 2 will
produce a hatch pattern with a scale of 10. If a strata is not
found in the Strata Definition File, the Hatch Scaler will be
multiplied by a value of 5 to set the hatch scale of the
strata.
Composite Strata to
Beds: This option will
composite strata together by Bed Name where applicable. In order to
use this option, both the Strata Name and the Bed Name must be
defined in the Strata Definition File.
Group Entities: This option
will draw each column as a group of entities (not to be confused
with a block entity).
Offset from Drillhole:
This value is only applied when the Draw... Next to
Drillhole option is selected. This value, relative to the
Horizontal Scale, determines the distance between the drillhole
symbol and the column.
Specify Elevation Range: This option will draw the column only between a range of elevations, set by the Top Elev and Bottom Elev values.
Specify Strata Range: This option will draw only a specific range of strata in the column. After clicking OK on the dialog, you will be prompted for the strata to draw, as shown below. If not all strata are shown in this dialog, clicking Skip to Next will scan another hole for strata layers. Portions of strata above/below the selected strata can also be drawn according to the Thickness Roof and Floor values, respectively.

Draw Strata Connections:
This option is not available when the Align
Horiz by Individual option is selected. This option will draw
polylines connecting similar strata between columns. Note that if a
strata or bed pinches out between columns, this pinchout will not
be drawn. After clicking OK on the dialog, you will be prompted for
the strata to connect, as shown below.

Connect By: This option will determine if connections are drawn according to Strata Names or Bed Names. If the Strata and Bed Name option is selected, connections will be drawn for individual strata layers. If the Bed Names Only option is selected, connections will only be drawn for the top and bottom of each bed - individual strata connections will not be drawn.
Sort Strata: This button will sort the list alphabetically by Strata Name.
Sort Bed: This button will sort the list alphabetically by Bed Name.
Grid Options: This button will open the below dialog, which
controls how the grid is drawn behind the column.

Grid Interval: This value sets the grid line spacing for the elevation and depth axes. For example, a Grid Interval of 25 will draw a tick/grid line every 25 drawing units (e.g. elevations 0, 25, 50, 75, etc.)
Text Interval: This value sets the text intervals for the elevation and depth axes. For example, a Text Interval of 100 will draw an elevation/depth label every 100 drawing units (e.g. at elevations 0, 100, 200, 300, etc.)
Draw Depth Axis: This option will draw a depth axis (vertical line) next to each individual column or at the beginning of a row of columns.
Draw Elev Axis: This option will draw an elevation axis (vertical line) next to each individual column or at the beginning of a row of columns.Draw Station Axis: This option will draw a stationing axis (horizontal line) between drillholes when the Align Horiz by Line Up or Projected methods are selected.
Station Interval: This value determines the grid line spacing and text interval for the stationing axis. For example, a Station Interval of 100 will draw a vertical tick/grid line and label every 100 drawing units (e.g. at stations 0+00, 1+00, 2+00, 3+00, etc.).
Grid Layer: This value determines the CAD Layer of the grid linework. The Set button can be used to select a pre-existing CAD Layer.
Grid Style: This option controls how the grid will be drawn.
The Grid Lines option will draw a true grid with lines spanning the appropriate axes.
The Ticks Only option will draw the grid axes, but instead of full lines spanning the axes, small tick marks will be placed along each axis.
The Ticks and Dots option will draw tick marks along each axis, as well as points where true grid lines would intersect.
Bar Graph Options:
This button will open the below dialog, which controls the bar
graph for acid-base accounting. The Bar Graph is only drawn when
the Draw on 2D Grid option is selected. This graph is
intended for acid-base accounting, but any drillhole attribute may
be used. The Bar Graph is logarithmic, ranging in value from -100
to 100. Any values outside of this range will be drawn at the
maximum value and a label will be drawn to indicate the true value.
In addition to the Bar Graph, a Scatter Graph may also be drawn.
This graph ranges in value from 4 to 10. Any values outside of this
range will be drawn off the graph.

Draw Bar Graph: This option will draw the Bar Graph when selected.
Use Red-Blue: This option will draw the Bar Graph with only red or blue hatches when selected. Red hatches are used for negative values and blue hatches are used for positive values.
Graph Name: This text string is the title of Bar Graph, which will be drawn below the X-axis values. An example of a geologic column with a bar graph is shown below.

This section of the help document discusses the
Label Settings, shown below.

No Label: This option will turn off labeling for the
column. This option will also ghost out all labeling options in the
dialog.
Draw as: This option
controls the type of text that is used for labels.
The DText option will use a standard text entity for
labels.
The MText option will use MText (multi-line text) entities
for labels.
The MLeader option will use Multileader entities for labels,
which are MText entities attached to a leader line.
Label Options: This button will open the below dialog, which controls many of the details of the column labels.

Elevation/Thickness/Depth Decimals: These options control the number of decimals to display for elevation, thickness, and depth labels, respectively.
Elevation/Thickness/Depth Label: These text strings set the prefix for elevation/thickness/depth labels, respectively.
Label Layer: This text string sets the CAD Layer for most label entities, such as the elevation, depth, station, and strata. The Set button may be used to select a pre-existing CAD Layer.
Attribute Layer: This text string sets the CAD Layer for attribute labels entities. The Set button may be used to select a pre-existing CAD Layer.
Label Style: This text string sets the text style for the labels. The Set button may be used to select a pre-existing text style. Text styles may be edited via the STYLE command.
Use Full Strata Name: This option will use the Full Strata Names found in the Strata Definition File for strata labels.
Attributes on Single Line: This option will place all attributes for a single strata on one row rather than placing each attribute on an individual row.
Draw Label Leaders: This option will draw red leader lines from the column to the strata label and attribute labels. Labels will sometimes be shifted away from the column to avoid overlaps. Without these leader lines, the labels may be difficult to match with the column.
Draw Ferm Codes: This option will label each strata with its Ferm Code in addition to the true strata name. If the Ferm Label option is set to Code, then the actual Ferm Code will be used. If the Ferm Label option is set to Full Description, then the full Ferm Code description will be listed rather than the Ferm Code itself.
Label by Grade Parameters: This option will add the Grade Name to the label, according to a Grade Parameters File. If this option is set to Left the Grade Name will be listed with the attribute label. If the option is set to Right, the label will be listed with the strata label.
Drillhole Options: This button will open the below dialog,
which controls many of the labels relating to the drillhole itself
(rather than labels relating to strata within the
drillhole).
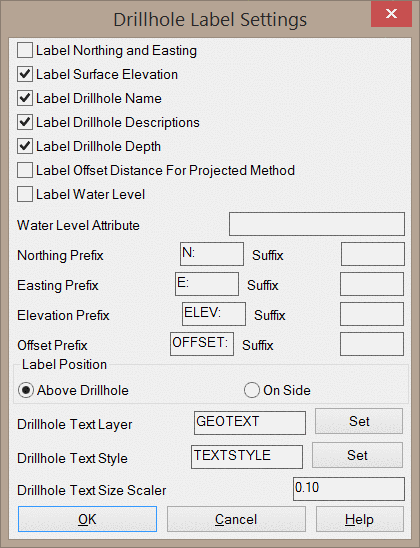
Label Northing and Easting: This option will draw a label of the Northing and Easting coordinates for each column.
Label Surface Elevation: This option will draw a label of the Surface Elevation for each column.
Label Drillhole Name: This option will draw a label of the Drillhole Name for each column.
Label Drillhole Descriptions: This option will draw a label of the Drillhole Description for each column.
Label Drillhole Depth: This option will draw a label of the maximum depth for each column.
Label Offset For Projected Method: This option is only applied when the Align Horiz by Projected option is selected. This option will draw a label indicating the perpendicular distance from the column to the alignment polyline.
Label Water Level: This option will draw a label of the water table elevation in the column. When this option is selected, the Water Level Attribute must match the name of the water level attribute defined in the drillhole. Note that the water level is an attribute of the drillhole itself; it should not be listed as an attribute of a particular strata.
Northing Prefix/Suffix: These two text strings will set the prefix and suffix for the label of the column Northing coordinate.
Easting Prefix/Suffix: These two text strings will set the prefix and suffix for the label of the column Easting coordinate.Elevation Prefix/Suffix: These two text strings will set the prefix and suffix for the label of the column Surface Elevation.
Offset Prefix/Suffix: This option will only be applied with the Align Horiz by Projected method is selected. These two text strings will set the prefix and suffix for the label of the column Offset from the fence alignment polyline.
Label Position: This option will determine where the drillhole label is drawn.
If the Above Drillhole option is selected, the label will be center justified above the column.
If the On Side option is selected, the label will be drawn to the right of the column.Drillhole Text Layer: This text string will set the CAD Layer for the drillhole label. The Set button may be used to select a pre-existing CAD Layer.
Drillhole Text Style: This text string will set the text style for the drillhole label. The Set button may be used to select a pre-existing text style. Text styles may be edited via the STYLE command.
Drillhole Text Sizer Scaler: This value, relative to the Horizontal Scale, will determine the size of the drillhole label. For example, a Horizontal Scale of 100 and a Drillhole Text Size Scaler of 0.15 will produce a drillhole label with a height of 15 drawing units.
Append Bed Name: This
option will label the Bed Name in addition to the Strata Name for
each strata in the column.
Thickness: This option
will draw a label for the thickness of each strata.
Label Strata On Single
Line: This option will place all strata labels on a single row
rather than placing each label on an individual row.
Label Strata...: This
option will determine which strata are labeled.
The All option will label all strata.
The Key-Only option will only label key strata.
The Selected option will prompt you to selected the strata
to label.
The Fit-Only option will only draw a label if the strata is
thick enough to place a label without having to adjust the label
position to avoid overlaps.
The Bed-Only option will only label strata with bed
names.
Elevation: This option
determines which elevation will be labeled for each strata.
If the None option is selected, no elevation label will be
drawn.
If the Top Elevation option is selected, the top elevation
of each strata will be labeled.
If the Bottom Elevation option is selected, the bottom
elevation of each strata will be labeled.
Depth: This option
determines which depth will be labeled for each strata.
If the None option is
selected, no depth label will be drawn.
If the Top Depth option is selected, the depth to the top of
each strata will be labeled.
If the Bottom Depth option is selected, the
depth to the bottom of each
strata will be labeled.
Bed Thickness: This
option will draw a label for the thickness of each bed.
This section of the help document discusses the Layer and Color
Settings, shown below.

Strata Layer: This
option will determine which CAD Layers are used for each strata in
the column.
If the Individually option is used, each strata will be
drawn on the CAD Layer specified in the Strata Definition File. If
the strata is not found in the Strata Definition File, each strata
will be drawn on a CAD Layer matching the name of the strata.
If the Non-Key Same option is used, all key strata
will be drawn as if the Individually option were selected
and all non-key strata will be draw on the CAD Layer specified just
to the right of this option. The ellipse button may be used to
select a pre-existing CAD Layer.
If the All Same option is selected, all strata will be drawn
on the CAD Layer specified just to the right of this option.
The ellipse button may be used
to select a pre-existing CAD Layer.
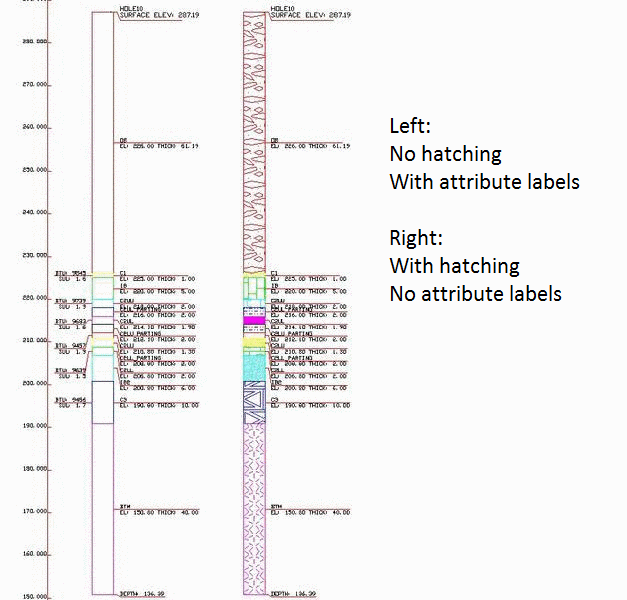
Fill By: This option
determines the hatch pattern for each strata.
If the Outline Only option is selection, no hatch pattern
will be drawn.
If the Hatch option is selected, the strata will be filled
with the hatch specified in the Strata Definition File. If a strata
is not found in the Strata Definition File, the strata will be
hatched with the ANSI31 pattern.
If the Solid Fill option is selected, all strata will be
hatch with the SOLID hatch pattern.
Color Strata by GPF:
This option will color each strata according to a Grade Parameters
File (GPF). When the Draw In 3D option is selected, the
strata width will be scaled according to the Geologic Column
Scaler defined for each grade in the Grade Parameters File.
This allows for more visual interpretation of high-grade and
low-grade sections of the column, as shown below.

Use Specific Strata Definitions: This
option will allow the use of a Strata Definition File (which
controls layering, colors, hatching, etc.) other than the one
currently set in the Mining Project Settings. The Set button
will prompt you for this Strata Definition File.
Select Attributes: After
clicking okay on the main dialog, you may be prompted for any
additional settings in the command line. If you have chosen to draw
strata/bed labels, you will see the below dialog, which allows you
to choose which attributes to label. You may select multiple
attributes by holding the CTRL or SHIFT keys while selecting
attributes. To clear the selection of attributes, click the
Clear button.


A color and hatch legend may be drawn via the Drawn Legend button
on the Strata Definition dialog (Geology Module > Drillhole
Pulldown Menu > Define Strata), as shown below.

Geologic Column Settings dialog
Select Drillholes for geologic column.
Select objects: pick the drillhole symbols
Select Attributes to Draw dialog
Pick location for geologic column: pick or enter the bottom
center point for the geologic column
Pulldown Menu Location: Drillhole
Keyboard Command: geocol