Edit Table Properties
This command allows you to edit the properties of an entity
based table.
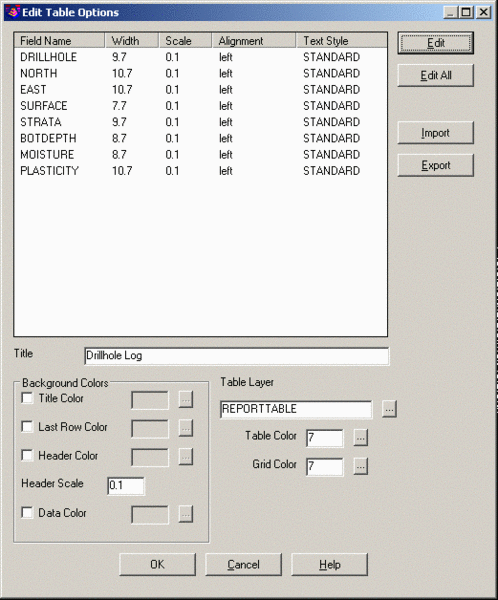
For general tables, the Edit Table Options dialog is shown. In
the dialog, you can change the header labels, width, size,
alignment and style. There are settings for the table colors, title
and layer.
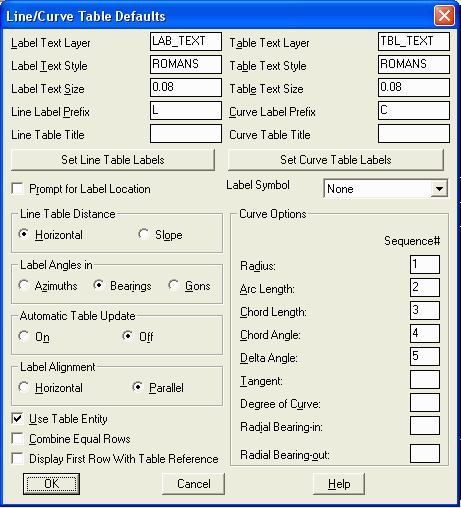
 For line and
curve tables, the Line/Curve Table Defaults dialog will be
displayed. Here you can change the settings of the selected table.
Change the settings for either line or curve tables depending upon
the type of table selected. The changes will be reflected once the
user selects the OK button.
For line and
curve tables, the Line/Curve Table Defaults dialog will be
displayed. Here you can change the settings of the selected table.
Change the settings for either line or curve tables depending upon
the type of table selected. The changes will be reflected once the
user selects the OK button.
Text Layer and Text Style determine the layer and style of the
line/curve table text. The distance for line tables can be labeled
in horizontal or slope distance. The Automatic Table Update option
will automatically insert the entry into the line or curve table.
The auto update will renumber the other table entries and the
associated labels in the drawing. For example, if a line table had
lines #1-5 and a line #4 was added, then the new line #4 would be
inserted into the table and the previous lines #4 and #5 would be
updated to #5 and #6. The L4 and L5 labels on the lines would also
be updated to L5 and L6. Without the automatic update option, the
entry location must be picked and the labels updated manually. The
Label Alignment determines the orientation of the L# or C# that is
labeled on the line or curve. Horizontal will make the label
horizontal to the current twist screen and Parallel will draw the
label parallel with the line or curve chord. The Line and Curve
Label Prefix sets the text before the number that is drawn in the
table and on the line or curve (i.e. "L3" or "Line3"). The Curve
Options specifies which curve data to include in the table and the
order. You specify the label and table attributes in the Line/Curve
Table Defaults dialog.
 Label
Text Layer: determines the layer of the line/curve text.
Label
Text Layer: determines the layer of the line/curve text.
Label Text Style: determines the style of the line/curve
text.
Label Text Size: determines the size of the line/curve
text.
Line Label Prefix: determines the prefix for each line.
Line Table Title: draws a title row at the top of the line
table with this string.
Table Text Layer: determines the layer of the line/curve table
text.
Table Text Style: determines the style of the line/curve
table text.
Table Text Size: determines the size of the line/curve table
text.
Curve Label Prefix: determines the prefix for each
curve.
Curve Table Title:
draws a title row at the top of the curve table with this
string.
Prompt for Label Location: prompts you to
pick the location to label each line or curve. If this is not
selected, the location is chosen automatically.
Under Line
Table Distance, the method for measuring distance is
specified.
Horizontal: The distance measured is only horizontal, even
if the line is a 3D polyline.
Slope: The distance measured is the slope distance,
used mostly for 3D polylines to get their true length.
Under Label Angles in, the type of angle is
selected.
Azimuths: The angles are reported as azimuth.
Bearings: The angles are reported as bearings.
Gons: The angles are reported as gons.
Under Automatic
Table Update, the option automatically inserts the entry
into the line or curve table. The auto update renumbers the other
table entries and the associated labels in the drawing. For
example, if a line table contained lines #1-5 and a line #4 was
added, then the new line #4 would be inserted into the table, and
the previous lines #4 and #5 would be updated to #5 and #6. The L4
and L5 labels on the lines would also be updated to L5 and L6. If
you set the Automatic Table Update to Off, you must manually pick
the entry location and update the labels. If Automatic Table Update
is set to On, the table is updated automatically whenever the line
is modified.
Label Alignment
determines the orientation of the L# or C# that is labeled on the
line or curve. Horizontal will make the label horizontal to the
current screen alignment, Parallel will draw the label parallel to
the line or curve chord. Under Curve Options, you specify which
curve data to include in the table and the order.
Use Table Entity: will use
single block for the whole table. Otherwise, each row is a separate
block.
Combine Equal Rows: will
use the same line or curve number when the data exactly matches an
existing row in the table. For example, if two line segments have
the same bearing and distance, then they would both get the same
line# (ie. "L5").
Display First Row With Table
Reference: When there is room on the line or arc, this
option will label both the number and the first column data value
from the table on the line or arc. For example, if the first curve
table column is for radius and the arc length is big enough to fit
the label, then the program would label both the curve # and the
radius (ie. "C5 R=100.0").
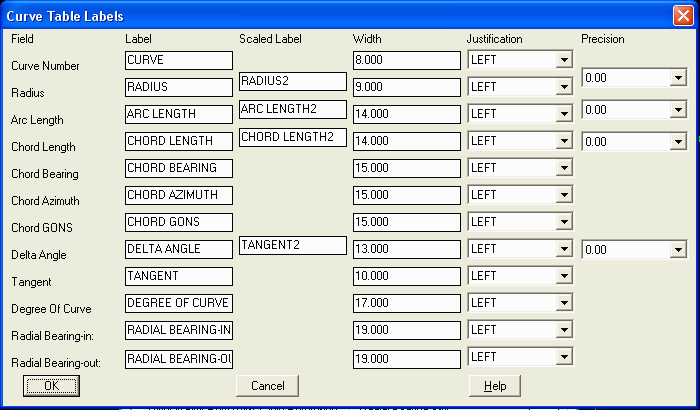
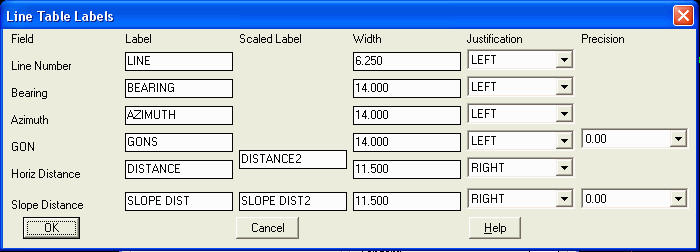
Selecting “Set Line Table Labels” will lead you to
the Line Table controls, as “Set Curve Table Labels” (see graphic
at end of this command page) leads to the Curve Table controls. For
fields that apply to the Report Scale Factor from Drawing Setup,
there is a second Scaled Label name for the table header. This
scale factor can be used for reporting both grid and ground or both
english and metric distances. The options in “Set Line Table
Labels” are shown below:
 With the above settings, for example, the Line
Table appears as shown below. For improved “aesthetics”, you might
prefer to change the Bearing justification to “Center”, for
example.
With the above settings, for example, the Line
Table appears as shown below. For improved “aesthetics”, you might
prefer to change the Bearing justification to “Center”, for
example.
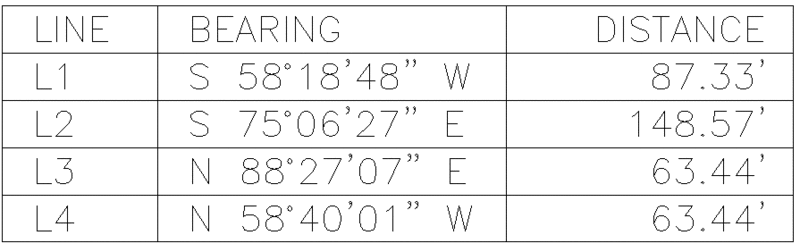 To save space, you can reduce the
size of the “Distance” column from 11.5 to 10. Note that using the
Line Label Prefix option, L1 and L2, for example, can read Line1
and Line2, and for that, you may want to expand the “Width” setting
for the Line column. The prefix flexibility, and the fact that the
text used for the column header can be changed, means that line
tables and curve tables can be plotted in any language. In Puerto
Rico, for example, surveys are typically conducted in bearings, in
meters and in Spanish. For that location, the table could be
reconfigured as shown here:
To save space, you can reduce the
size of the “Distance” column from 11.5 to 10. Note that using the
Line Label Prefix option, L1 and L2, for example, can read Line1
and Line2, and for that, you may want to expand the “Width” setting
for the Line column. The prefix flexibility, and the fact that the
text used for the column header can be changed, means that line
tables and curve tables can be plotted in any language. In Puerto
Rico, for example, surveys are typically conducted in bearings, in
meters and in Spanish. For that location, the table could be
reconfigured as shown here:
 This would lead to the following line
table:
This would lead to the following line
table:
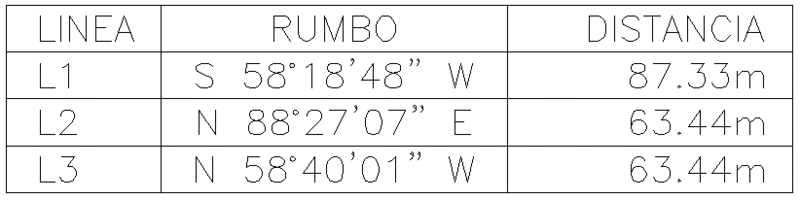 Note that changing the distance
suffix to “m” (or omitting any suffix by making it blank) is
accomplished in the more general command Annotation
Defaults.
Note that changing the distance
suffix to “m” (or omitting any suffix by making it blank) is
accomplished in the more general command Annotation
Defaults.
Finally, below we see the
dialog that appears when you choose Set Curve Table Labels.
Prompts
Select a line or curve table to
modify: pick an entity
based line or curve table.
Pulldown Menu Location: Annotate > Line/Curve Table
Keyboard Command: tabedit
Prerequisite: An entity based line or curve table.