This command has a collection of tools to analyze the runoff of
a surface defined by a triangulation or grid surface file. After
selecting the surface file of the surface, the program docks a
dialog on the left side of the drawing window. While the Watershed
Analysis dialog is running, other AutoCAD and Carlson commands are
not available. To zoom or pan the drawing view, use the buttons at
the top of the dialog, or use the middle button of a
wheel-mouse.
Watershed Analysis calculates the flow connections between the
triangles and along the edges of the triangulation. The
Rainfall amount is used in
the processing for figuring the runoff volume to determine when the
volume is enough to spillover a local depression in the surface.
Besides the Rainfall amount, the runoff coefficients as defined in
Define Runoff Layers are also used to calculate the runoff volumes.
When the local depression is small enough the runoff will continue
through. Otherwise this spot is called a sink for where the runoff
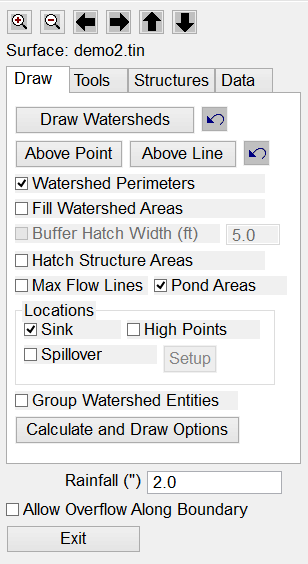
stops. The Allow Overflow Along
Boundary option applies to watersheds that have runoff that
hits the surface border. This option will check whether this border
runoff can spillover and merge with the neighboring watersheds
along the border.
The Draw Watersheds
function draws the watershed areas using the settings under the
Draw tab. The back arrow next to the Draw Watersheds button will
erase any previous Draw Watershed entities. The Watershed Perimeters option will draw
closed polyline perimeters for each watershed area. The
Fill Watershed Areas option
will solid fill hatch each area using different colors. The
Buffer Hatch option will
hatch the perimeters of the watershed areas with the specified
width instead of hatching in the entire watershed area. The
Hatch Structure Areas
option will hatch the drainage areas covered by structure inlets
defined in the Structures tab. The Sink Locations setting draws a symbol
at the low point for each drainage area. The High Point Locations option draws a
triangle symbol at the highest point within each watershed.
Typically, this high point will be along the watershed boundary
polylines that follow the high points along the ridges between the
watersheds. The Pond Areas
option draws a solid fill hatch in blue for the area covered by the
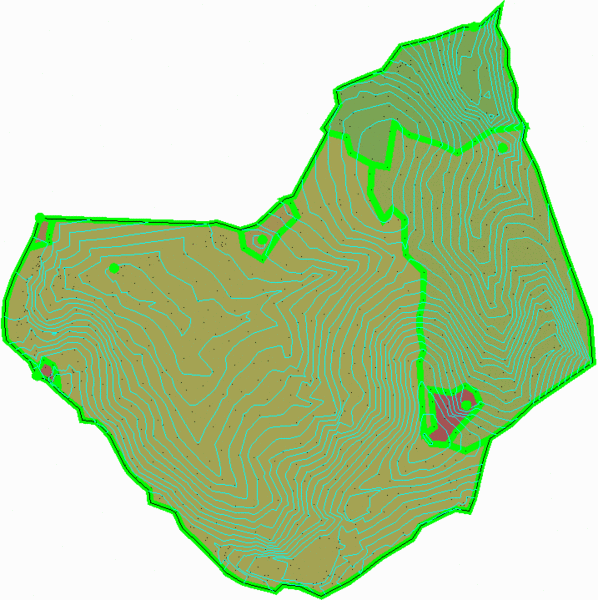
runoff volume of low points. In the example shown, the Fill
Watershed Areas and Sink Locations options are active. The
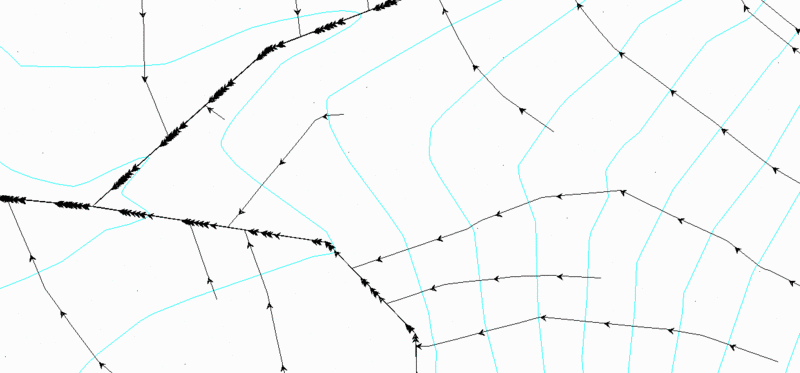
Max Flow Lines option draws
polylines for the longest flow line within each watershed. These
longest flow polylines can be used to calculate the time of
concentration. The Group Watershed
Entities option will make AutoCAD groups for the set of
entities drawn for each watershed.
The Spillover Location option draws symbols at low points within the watershed area that fill up with runoff and spillover on the way to the lowest (sink) location of the watershed. The Setup button allows you to specify criteria for identifying spillover points. These settings include the minimum drainage area, storage volume, drainage volume.
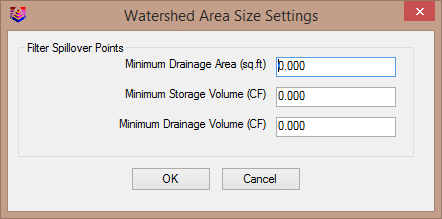
These settings allow you to filter out small spillover points (ie a
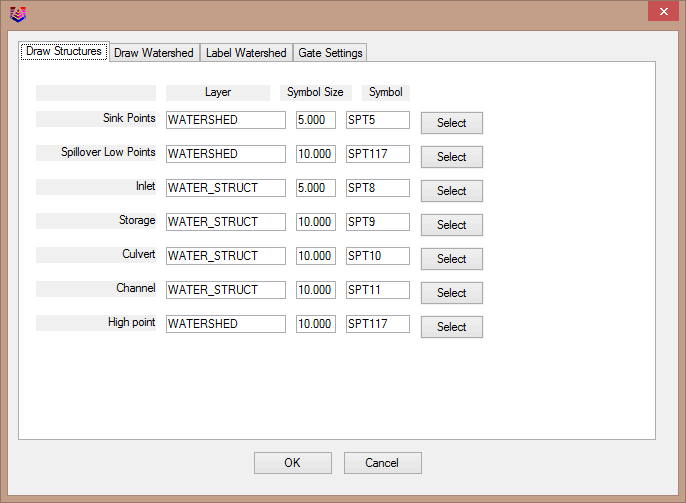
pothole) and only draw the significant ones. The Calculate and Draw Options buttons allow you to control
what is going to be drawn how, it contains settings for the
symbol, size and layers to use for the entities created by
Watershed Analysis and a number of labeling options.
 Gate Control
The watershed calculation can be controlled through use of
"gates". Gate is placed at the points of likely overflow from one
watershed to another. The gate in its natural state is simply an
indication that potentially the connection can occur at the point,
joining two watershed areas into one if there is too much runoff
volume in at least one of the watershed areas to be contained
within. The gate can also be forced closed, which indicates that
two areas will not be joined regardless the runoff amount. The
example of such case is when there are two large ponded areas you
want to treat separately in calculations or further design. On flip
side, there are instances when you may want two areas to be joined
regardless the overflow actually occurring, for example one area is
very small. This is accomplished with a gate forced open. There two
ways to control gate state: automatically and manually. Here are
the settings for automatic control.
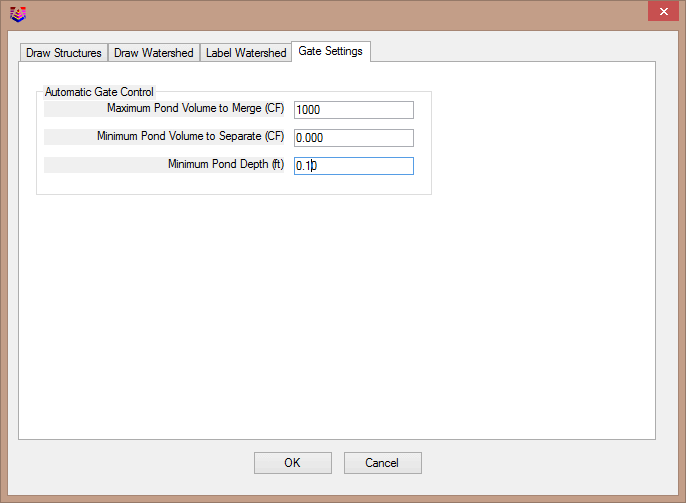
If amount of ponded runoff in an area exceeds the maximum pond
volume to merge, the downstream gate will be closed automatically.
If area is too small or too shallow, its downstream gate will be
forced open, joining it with watershed downstream.
To control gates manually, please first draw gate labels, exit
Watershed Analysis, then double-click on gate labels in the drawing
to control their state. Once done editing the gate state, just
re-run the calculation to draw and report the new adjusted
watersheds.
The Above Point function
reports the watershed data of the current pointer position in
real-time as the pointer is moved around. The watershed data is
shown in a tooltip next to the pointer position. This data has
values for the overall watershed that the position is in including
the sink elevation, sink name, drainage area and average slope
percent. This data also has values for the watershed above the
current point including the drainage area and runoff volume. Plus
this data shows the elevation and runoff coefficient at the current
point. If the position is picked with the mouse, then the program
draws a polyline perimeter for the drainage area above the current
point.
The Above Line function
is similar to Above Point except that you pick two points and the
program draws the watershed for all flow that crosses the line
between these two points. For example, you can pick points at the
left and right banks of a stream to get the drainage area for that
stream above these points.
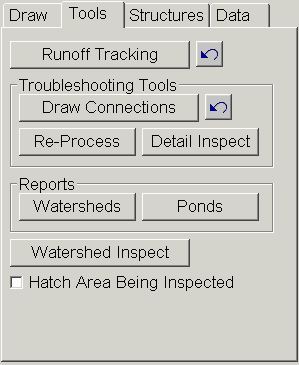
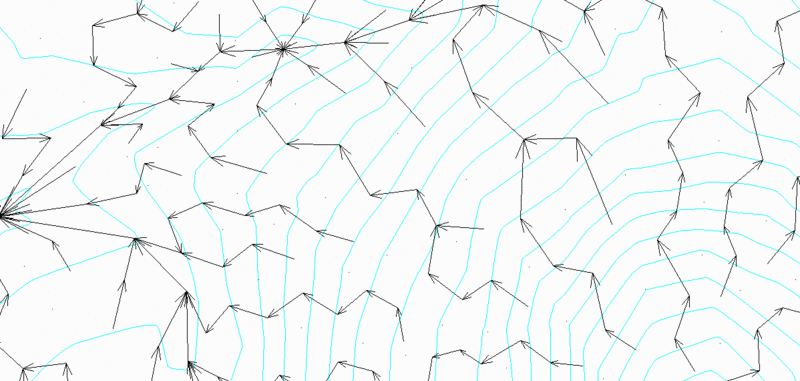
The Draw Connections
function draws lines with arrows between the triangles for how the
program has determined their flow connections.
When a triangulation file is processed by Watershed Analysis,
some of the flow connection data is stored into the triangulation
file to speed up reprocessing. The Re-Process function resets this flow
connection data to start the flow calculations from
scratch.
The Detail Inspect
function reports flow connection data at the pointer position in
real-time as the pointer is moved. This data includes the current
position triangle number, connecting flow triangle number, sink
node number, watershed name, border elevation, ridge elevation, low
elevation, downstream sink number, number of source triangles,
number of source nodes, current elevation and spillover
elevation.
The Watershed Inspect
function reports runoff flow data at the pointer position in
real-time as the pointer is moved. The runoff data is shown in a
tooltip next to the pointer and in the Data tab. This data has values for the
overall watershed that the position is in including the sink
elevation, sink name, drainage area and average slope percent. This
data also has values for the watershed above the current point
including the drainage area and runoff volume. Plus this data shows
the elevation and runoff coefficient at the current point. When the
Hatch Area Being Inspected option is active, the watershed area for
the current position is hatched during inspection.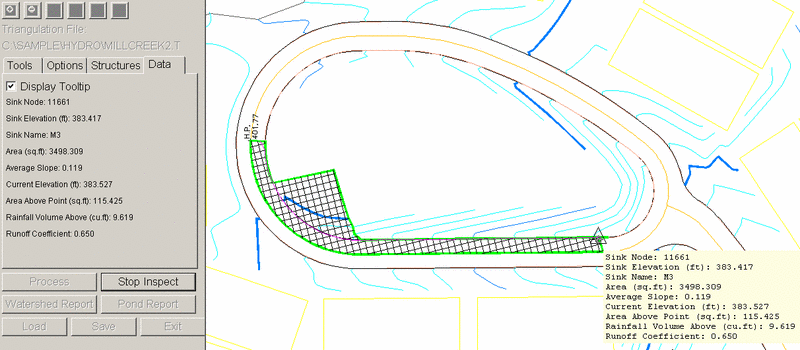
The Watersheds Report
function runs the report formatter to choose which of the watershed
parameters to report. The Ponds
Report function reports the position and depth of each
ponding area.
Here are some of the values contained in watershed report:
Rain volume - total volume of the runoff for the area
Holding volume - the maximum volume the watershed can
contain near the sink
Ponding volume - the volume of all the ponds within the
watershed
Uncontained volume - the difference between amount of runoff
and the volume of runoff trapped on the slope or at the
sink
Additionally, the properties of the pond at the sink are
reported: surface elevation, max depth, volume and area.
Besides calculating the runoff of the triangulation surface,
Watershed Analysis can also process the runoff effects from
structures for inlets, storage ponds, culverts and channels. The
structures in Watershed Analysis are simply for placement and
watershed delineation. These structures do not have design
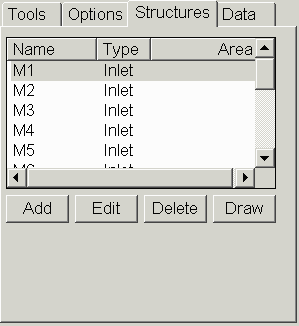
considerations for parameters like pipe size. In the Structure tab, there is a list of the
structures to apply with the current surface. The list shows the
name, type and drainage area for each structure. The Draw function
will draw symbols for each structure. The Inlet structures act as
sinks in the watershed and capture all the flow that comes to the
inlet point. Each inlet is defined by a single point and a name.
The Storage Tank structures also act as sinks and are defined by a
single point and name. The Culvert structures route the flow from
the culvert inlet to the outlet. The culverts are defined by two
points for the inlet and outlet and by a name. The Channel
structure is the same as the Culvert except that it can have more
than two points to define the flow path. The structure data can be
stored to a Watershed Structure File (wst) using the Save button. The Load button can read the structure data
from either a wst file or from a sewer network file (.sew).
Pulldown Menu Location: Watershed
Keyboard Command: watershed
Prerequisite: Triangulation File