This command calculates the minimum, maximum, average, slope,
and standard deviation of strata values in drillholes or from
grids. These values can be the strata thickness, bottom elevation,
or user-defined attributes such as BTU or GRADE. The statistics are
calculated from either drillholes or a grid file. With drillholes,
the statistics are calculated using the drillhole data points. With
Geologic Model and grid files, the data points are the grid cells.
Using a grid allows you to analyze an area by selecting inclusion
and exclusion closed polylines of the area. Grid or drillholes both
handle pit names for analyzing multiple areas at once. A grid file
of a strata attribute can be created with the Make Strata Grid File
or Autorun Strata Grids commands. The Statistical Analysis program
starts with the option to use Grid, Geologic Model or Drillholes.
With the Grid option, the grid file (.grd) to process can be
selected individually in the standard file selection dialog. The
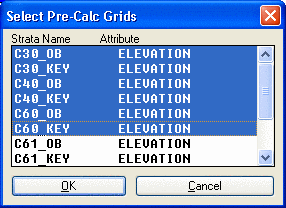
Geologic Model option allows you to select multiple grid files from
a Geologic Model File (.pre) that stores a series of grid files, as
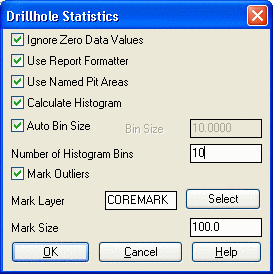
shown by highlighting multiple strata at one time. There are
options for histogram and Bin size in the reports, as well as
marking the outliers in the drawing for detailed review. The report
can be viewed in the standard report viewer, or it can be turned on
to use the report formatter.
For drillhole statistics:
Calculate statistics from grid file or drillholes
(Grid/Model/<Drillholes>)? press Enter for
drillholes
Ignore zero values (<Yes>/No)? press
Enter
Select the DrillHoles for report.
Select objects: select the drillhole symbols
Choose Strata to Process
Calculate THICKNESS statistics for strata X (<Yes>/No)?
No
Calculate BOTTOM ELEVATION statistics for strata X
(<Yes>/No)? No
Calculate BTU statistics for strata X (<Yes>/No)?
Yes
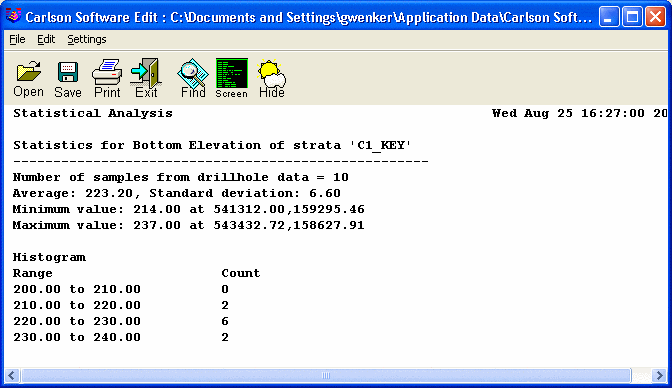
Number of samples from drillhole data = 38 Ignored 34 zero
values
Average: 10410.42, Standard deviation: 1371.25
Minimum value: 2305.00, Maximum value: 11147.00
Write report to file (Yes/<No>)? Yes
Enter the file name to write: report.txt
Write report to printer (Yes/<No>)? Yes
Make sure printer is on-line and connected to the printer
port.
For grid and Geologic Model statistics:
Calculate statistics from grid file or drillholes
(Grid/Model/<Drillholes>)? Model
Use named pit areas (Yes/<No>)? press Enter
for No
Reading cell> 2989 Choose grid to process
Extrapolate grid to full grid size (Yes/<No>)? press
Enter Answer yes to calculate values outside the limits of the
data to the full grid size.
Select the Inclusion perimeter polylines or ENTER for none.
Select objects: option to pick closed polylines
Select the Exclusion perimeter polylines or ENTER for
none.
Select objects: option to pick closed polylines
Number of samples from grid data = 612
Average: 10457.55, Standard deviation: 816.20
Minimum value: 3464.57, Maximum value: 11111.71
Pulldown Menu Location: StrataCalc
Keyboard Command: chstats
Prerequisite: Drillholes or grids