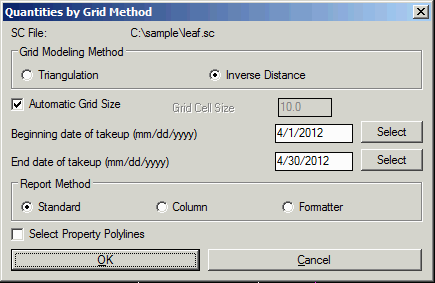
Quantities by Grid Method is one of two commands that calculate tonnages based on pillars, perimeter and coal cross section data. The other routine is Quantities by Average Method. The average method is faster and requires fewer coal section sample points, but the grid method is more accurate because it creates a 3D model of the strata which finds deviations the averaging misses. Either Triangulation or Inverse Distance methods can be used for the grid model.
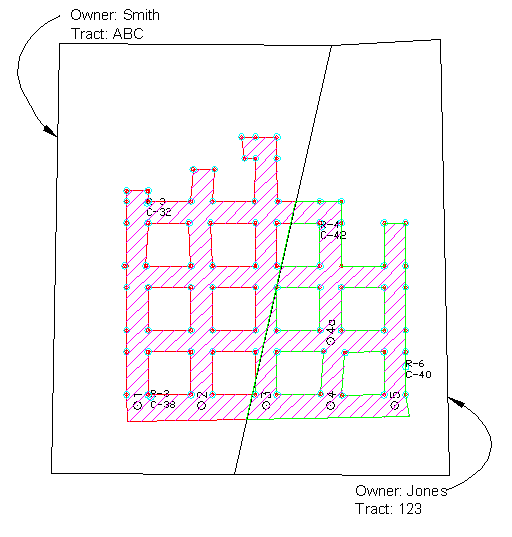
Before executing this command, there must be at least three sample coal section points and pillar and perimeter polylines in the PILLARS and PERIM layers. Perimeters may only be used one at a time. The pillars and perimeter polylines can be made with the Draw Pillars, Draw Perimeter, or AutoMine Connection commands, and sample points are placed by the Place Coal Sections command. Also property owner polylines can be used as described in the Quantities by Average Method command.
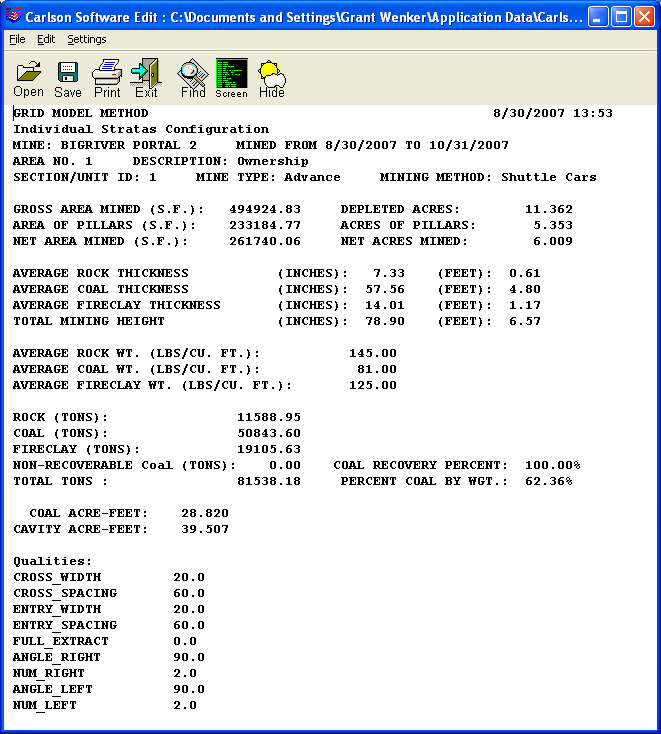
Quantities by Grid Method generates a detailed report when it is
done calculating. Besides this detailed report, Report Tons &
Acres gives coal tonnage reports based on data files that
Quantities by Grid Method updates. In order to have these data
files updated, you must enter beginning and ending dates and an
ownership name when prompted. If this information is entered,
Quantities by Grid Method will add the current coal tonnage to the
data file for the specified ownership name. The data files for the
mine and panel names will also be updated if they are specified.
The first time a mine or panel data file is accessed, it will ask
for the estimated coal reserves. There are three options for
reporting, Standard, Column and Formatter.
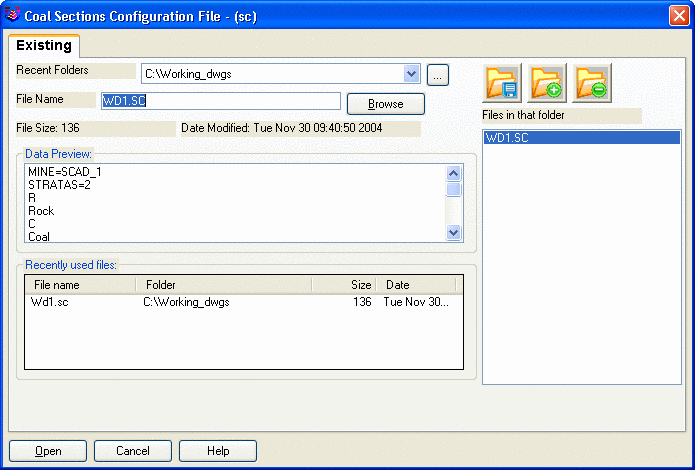
Select the file that defines the coal section sample points.
Coal recovery percent
<100.00>: press Enter
Select property polylines or press
Enter for none: select
property boundaries only
Select pillars, perimeters, &
at least 3 coal section points Select these carefully to
only include the ones for the calculation. If you select more than
you need and the hatching does not look correct, undo and
repeat.
Processing cells ...
Another area [Yes/<No>]? If you want to process more
than one area and calculate them together select another area. When
you have selected all of the areas the program prompts you for the
location if the report.
Start point or
Center/Middle/Right/?:
Height <6.00>: 10
Rotation angle
<90d0'0">: press Enter
Layer for text
<REPORT_TXT>: press Enter You can assign a new layer name
if you choose.
Insert as MText or Text
[<MText>/Text]?: press Enter
Update coal tonnage files
[<Yes>/No]? N
 Report window
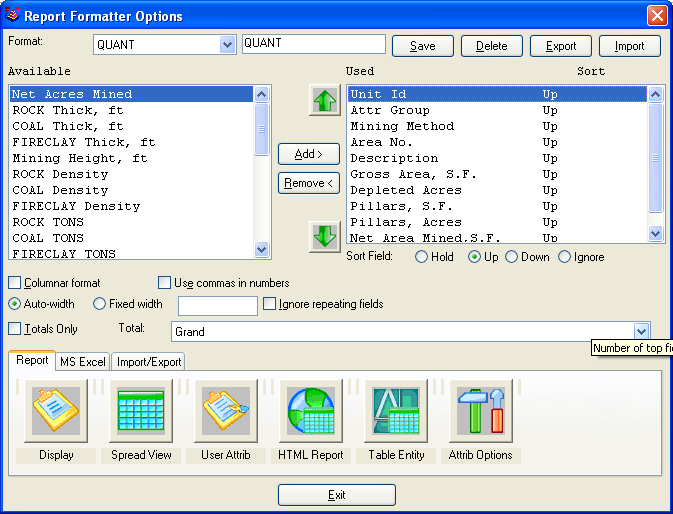
Report Formatter
Pulldown Menu Location: Works
Keyboard Command: qgrid
Prerequisite: At least three coal sections and pillar and
perimeter polylines