Quantities by Average Method is one of three commands that calculate tonnages based on coal cross section data. The other routines are Quantities by Grid Method and Quantities by Centerlines. The grid method is more accurate but the average method is faster and requires fewer coal section sample points. The centerline method uses entry row centerlines instead of pillar and perimeter polylines.
Before executing this command, there must be sample coal section points and pillar and perimeter polylines in the PILLARS and PERIM layers. The pillars and perimeter polylines can be made with the Draw Pillars, Draw Perimeter, or AutoMine Connection commands, and sample points are placed by the Place Coal Sections command.
The quantities can also be reported by property owner. The property areas are defined by closed polylines with an attached property name. There are routines in the Boundary menu of the Underground Mining module for assigning the property names to the polylines. Quantities by Average Method will prompt you to select property polylines. If you do not select any, then just the total quantities will be reported. Otherwise the quantities are divided between the properties and reported separately.
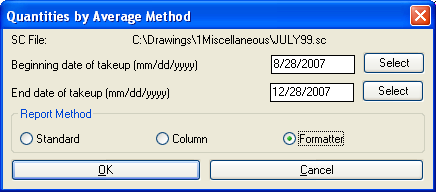
Quantities by Average Method generates detailed a report when it
is done calculating. The format of the report method can be
Standard text, Column text, or reported with the Report Formatter.
Besides this detailed report, the command Report Tons and Acres
gives coal tonnage reports based on data files that Quantities by
Average Method updates. In order to have these data files updated,
you must enter beginning and ending dates and an ownership name
when prompted. If this information is entered, Quantities by
Average Method will add the current tonnage to the data file for
the specified ownership name. The data files for the mine and panel
names will also be updated if they are specified. The first time a
mine or panel data file is accessed, it will ask for the estimated
coal reserves.
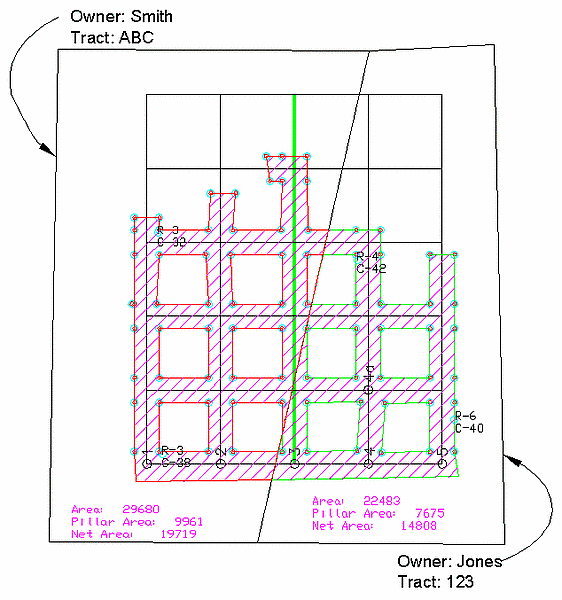 Hatched drawing with the area
summaries for each property boundary
Hatched drawing with the area
summaries for each property boundary
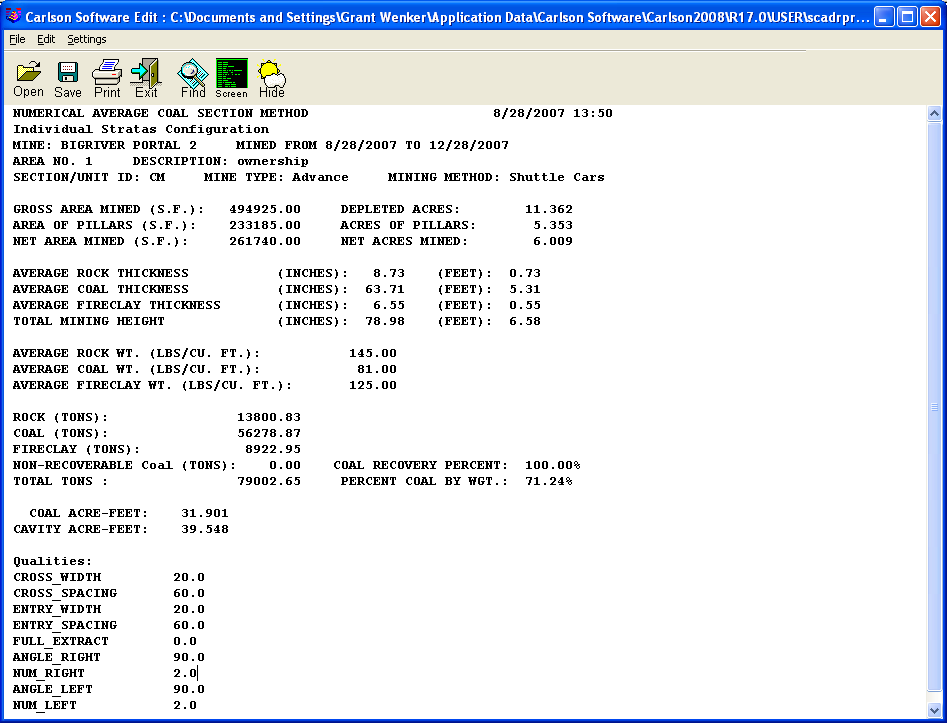 Text Report Example
 Report Formatter
option
Report Formatter
option
Coal Section Configuration File Dialog
Select property polylines or press Enter for none:
select the property
boundaries
Coal recovery percent <100.00>:
press Enter
Which type of selection? [<Standard>/Cuts]:
press Enter
Select pillars, perimeters, and section sample points.
Select these carefully so you only choose the pillars inside the
perimeters. Section sample
points can be selected outside the perimeter, if they contribute to
a more accurate answer.
Pick location to draw results or Enter for none: This is
where the Area/Pillar Area/Net Area will be posted for the first
property boundary.
Pick Alignment Point: This sets the text direction.
Pick location to draw results or Enter for none: This is
where the Area/Pillar Area/Net Area will be posted for the second
property boundary.
Pick Alignment Point: This
sets the text direction.
Another area
[Yes/<No>]? N
Start point or Center/Middle/Right/?: This refers to the
insertion point for the text report to be posted.
Height <6.00>: 10
Rotation angle <90d0'0">: press Enter for East to West (Horizontal)
text
Layer for text <REPORT_TXT>: You can set any layer for the text
report.
Insert as MText or Text [<MText>/Text]?: press Enter for MText
Update coal tonnage files [<Yes>/No]? N
Pulldown Menu Location: Works
Keyboard Command: qavg
Prerequisite: Pillars and perimeter polylines and coal
sections