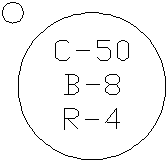
The following figure shows how this
section will appear in the drawing.
Once the mine map is completed using the techniques described in
the previous section, quantities of mined mineral and waste rock
may be computed, with industry standard reports. The reports will
be generated based on the reporting method selected in the Mining
Settings under Settings, Carlson Configure dropdown menu.
(1) Configuring the Section Information
Configuring the section information involves assigning each strata
a name and a density, and specifying the look of the section for
when it is placed in the drawing. This information is stored in a
user-specified file and is referenced for locating sections in the
drawing and for quantity calculations. If you reconfigure an
existing section file, sections placed in the drawing using the
previous section file become invalid and must be replaced. The
strata in a section can be configured as either individual or
composite. With the individual configuration, each strata has its
own name and density. With composites, each strata is still named
separately but they also are divided into groups that have a group
name and density. The principle advantage to composites is that it
allows you to enter and list out each strata height and then
combine the strata into their corresponding composite category when
generating tonnage quantities. First, let's configure an individual
section. Select Configure Section Info in the Works dropdown.
Enter Coal Section
Configuration Filer Name (MINE.SC)
Mine Name: Round Mountain
Enter Abbreviated Strata Name/<ENTER> to End: C
This name is drawn next to the corresponding height when a section
is located in the drawing.
Enter The Full Strata Name <C>: Coal This name
is used in quantity reports.
Enter Abbreviated Strata Name/<ENTER> to End:
B
Enter The Full Strata Name <C>: Bone
Enter Abbreviated Strata Name/<ENTER> to End:
R
Enter The Full Strata Name <C>: Rock
Enter Abbreviated Strata Name/<ENTER> to End: press
Enter
Enter Individual densities or Composite densities (I/C)
<I>: press Enter
Average wt. of C (Coal) [lbs/ft^3]: 80
Average wt. of B (Bone) [lbs/ft^3]: 150
Average wt. of R (Rock) [lbs/ft^3]: 150
Circle the Coal Section (y/<n>)? Y This
specifies whether a circle is drawn around the section when it is
placed in the drawing.
Plot the Numeric Value Only (y/<n>)? press
Enter
Text Size <6.0>: press Enter
Enter thickness in feet or inches
[Feet/<Inches>]? I for Inches
Prompt for entry width
[Yes/<No>]? Y if Yes Linear Advance will also be
reported
Now let's make a composite section. Select Configure Section Info in the Works dropdown.
Enter Coal Section
Configuration Filer Name: SECTION2 Or the name of
your choice.
Mine Name: Round Mountain
Enter Abbreviated Strata Name/<ENTER> to End:
TC
Enter The Full Strata Name <C>: Top Coal
Enter Abbreviated Strata Name/<ENTER> to End:
TR
Enter The Full Strata Name <C>: Top Rock
Enter Abbreviated Strata Name/<ENTER> to End:
BC
Enter The Full Strata Name <C>: Bottom Coal
Enter Abbreviated Strata Name/<ENTER> to End:
BR
Enter The Full Strata Name <C>: Bottom Rock
Enter Abbreviated Strata Name/<ENTER> to End: press
Enter
Enter Individual densities or Composite densities (I/C)
<I>: C Define
the Composite categories.
Enter Composite Category/<Enter> to END:
Coal
Average wt. of COAL [lbs/ft^3]: 80
Enter Composite Category/<Enter> to END:
Rock
Average wt. of ROCK [lbs/ft^3]: 150
Enter Composite Category/<Enter> to END: press
Enter Assign the strata to a Composite category.
Enter Composite Category for Top Coal TC (COAL ROCK ):
coal
Enter Composite Category for Top Rock TR (COAL ROCK ):
rock
Enter Composite Category for Bottom Coal BC (COAL ROCK ):
coal
Enter Composite Category for Bottom Rock TC (COAL ROCK ):
rock
Circle the Coal Section (y/<n>)? press
Enter
Plot the Numeric Value Only (y/<n>)? press
Enter
Text Size <6.0>: press Enter
Enter thickness in feet or inches
[Feet/<Inches>]? I for Inches
Prompt for entry width
[Yes/<No>]? Y if Yes Linear Advance will also be
reported
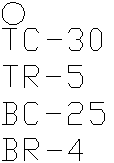
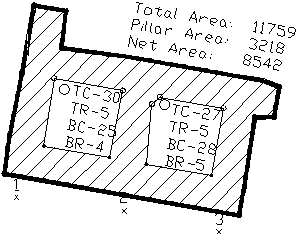
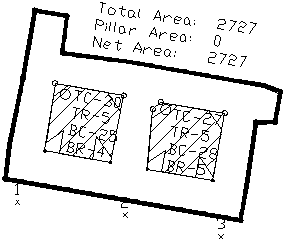
The following figure shows how this section will appear in the drawing.
(2) Locating Sections
To locate section information measured from the mine, select Place
Coal Sections from the Works dropdown. Select the desired section
configuration file such as SECTION2 which you defined in the
previous section.
Pick sample point for coal section: pick a point on
the map. This is the point where the measurements came
from.
Pick Start Point: pick another point. This is
where the text will be plotted. The text may be placed anywhere you
like because the program gets the section measurements from the
small circle at the sample point and not from the text.
Pick Alignment Point: pick a point to align the text
Now enter your measurements.
How many inches of Top Coal TC: 30
How many inches of Top Rock TR: 5
How many inches of Bottom Coal BC: 25
How many inches of Bottom Rock BR: 4
Enter the entry width:
20
Enter Another Section (Y/N) <Y>: press
Enter
Enter the other section as shown in the next figure.
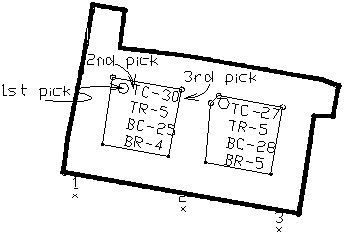
|
| Placing a section |
(3) Compute tonnages by average or modeled grid
methods
There are three routines for calculating tonnages: Quantities by
Average Method, Quantities by Grid Method and Quantities by
Centerline. These methods require section sample points, and
pillars and a perimeter defined as closed polylines in the PILLARS
and PERIM layers respectively. As its name suggests, the average
method uses the average values from sample section points to
compute its quantities. The grid method actually models the values
of the sample points over the mined area which results in more
accurate tonnages. For now, let's use the average method because it
is much faster and requires fewer sample points.
Select Quantities by Average Method in the Works
dropdown.
Select a Mining Project Definition
(MPD) File or Create a new one
Select the file that defines the section sample points
Specify the
Beginning and Ending dates of take-up and Report Format in the
dialog below

Select property polylines or press Enter for
none: press Enter if no
property lines defined, if defined program gets Owner Name from
here
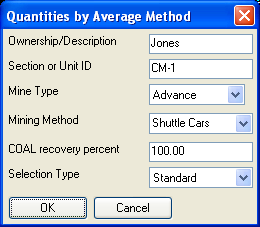
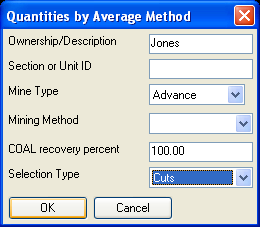
Fill in the Following Dialog:
if any field is left blank it
will not be reported
Select pillars, perimeters, and section sample
points.
Select objects: select the pillars,
perimeter, and sample points
Pick location to draw results or Enter for none: pick a
point above the mine as shown
Another Area (Y/N) <Y>: N
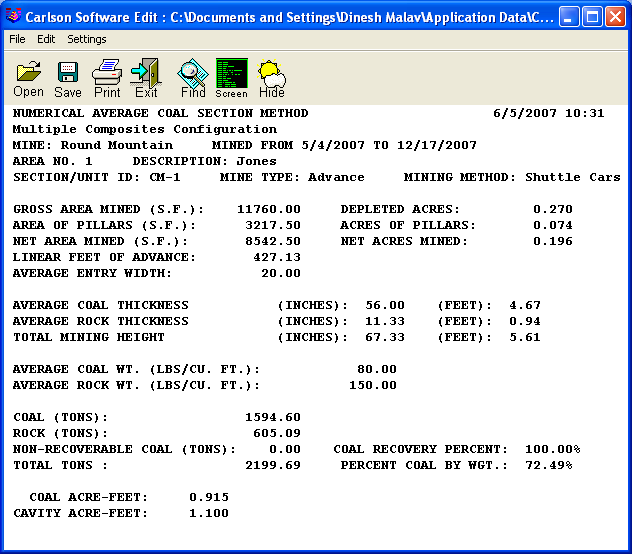
 Quantities by Average
Method Quantities by Average
Method |
A report would be generated based on the Report Format method. If standard method selected following report would be generated
Update coal tonnage files (<Y>/N)? Y
This option updates data files for tonnage reports.
Enter a mine name: Mine
Enter a panel name: press Enter for none
Enter the estimated coal reserves for mine Mine:
300000
(4) Draw and compute volumes for pillar cuts on
retreat
One of the final steps in underground mining is cutting into the
pillars on the "retreat". The results of these cuts can be quickly
drawn on the mine map using the Pillar Cut routine in the Works
dropdown. The procedure is simply to pick a cut pattern and then
place the pattern inside the pillar to be cut. That's it. Depending
on the selected method, this routine will either redraw the
pillar's polyline with the cuts removed, or it will create new
perimeter polylines inside the pillar in the cut out spaces. The
pillars must be closed polylines in the PILLARS layer. The rotation
of the placed pattern will follow the current snap. If the cut
pattern you need is not already in the table, you can define your
own by first drawing a polyline of your pattern and then selecting
the user-defined box in the Pillar Cut symbol table.
After redrawing the cut pillars with Pillar Cut, Quantities by Average Method or Quantities by Grid Method can be used to compute the quantities of the cuts. If the Cut option of Pillar Cut was used, then you will get the total quantities from the area between the pillars plus the pillar cuts. To get the quantities of only the pillar cuts, use the Perim option of Pillar Cut. This will create perimeter polylines inside the pillars. Then use Quantities by Average Method and select all these perimeter polylines. Let's practice pillar cuts.
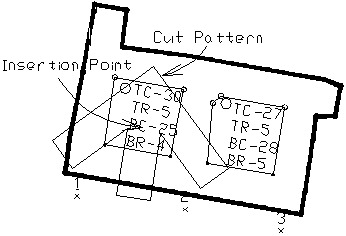 Locating a pillar cut
pattern Locating a pillar cut
pattern |
Select Pillar Cut from the Works dropdown.
Choose the Cut 14 symbol or the symbol of your choice.
Perimeter layer
<PERIM>:press
enter
Enter the azimuth for the cuts
<0.0>: 10.0
Cut the pillar or create new
perimeter? (<Cut>/Perim) Perim
Hatch the new perimeter polylines?
(Y/<N>) press
Enter
Select mine pillars
Polylines in the PILLARS layer.
Select objects:
select all the pillars
Pick a point for the
symbol: pick a point as
shown in the figure above
Do another cut [<Yes>/No]?
Y
Pick a point for the symbol:
pick a point in the other pillars
Pick a point for the
symbol: press
Enter to exit
Now let's get the quantity mined from the pillar cuts.
Select Quantities by Average Method in the Mining Works
dropdown. Choose Section2 or the file that defines the section
sample points.
The Cuts "Selection Type" filters out everything except
perimeter polylines and sample points. This allows you to select by
windowing the area of the pillar cuts. Be sure not to include the
main, outside perimeter.
Select objects: select
the perimeter polylines and sample points
Pick location to draw results or
Enter for none: pick a
point above the mine
Another Area (Y/N)
<Y>: N
Update coal tonnage files (<Y>/N)? Y This
option updates data files for tonnage reports.
Enter a mine name: Mine
Enter a panel name: press Enter for none
Enter the estimated coal reserves for mine Mine:
300000
This creates the following plot.
Pillar cut quantities
|