Graphic Reports
The Graphic Report commands can be used to create .PDF files for
different Profiles, Cross Sections, 3D Surfaces, and of the Plan
View. Adobe Reader or Pro is required for these routines to
function.
The Plan Graphic Report command creates a plan view report of the
site. Isolate the layers you want to show up in the report before
you run this command. The routine will zoom extents to the limits
of the layers you select and fit them to the Paper Size you
select.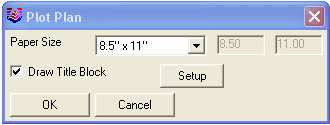 The Title Block Setup dialog draws a border and
title block for the selected sheet size. Here you can enter in text
you want to displayed in the report.
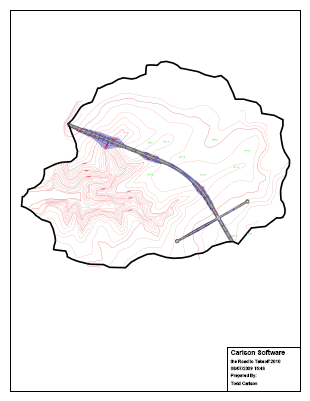
 Here is
an example of the Plan Graphic Report.
 The
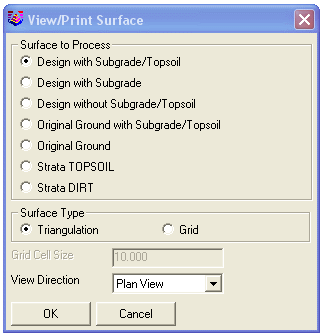
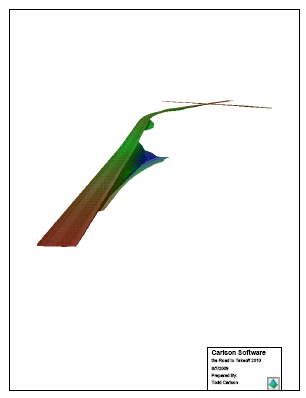
Surface Graphic Report command creates a 3D view PDF report of any
surface (.tin or .flt files) created in the drawing, including
existing, design, and strata surfaces. In the first dialog, select
the surface you wish to see in the report. This dialog also gives
you the option to view the surface as a triangulation mesh or grid.
View Direction determines the orientation of the surface in the
next dialog.
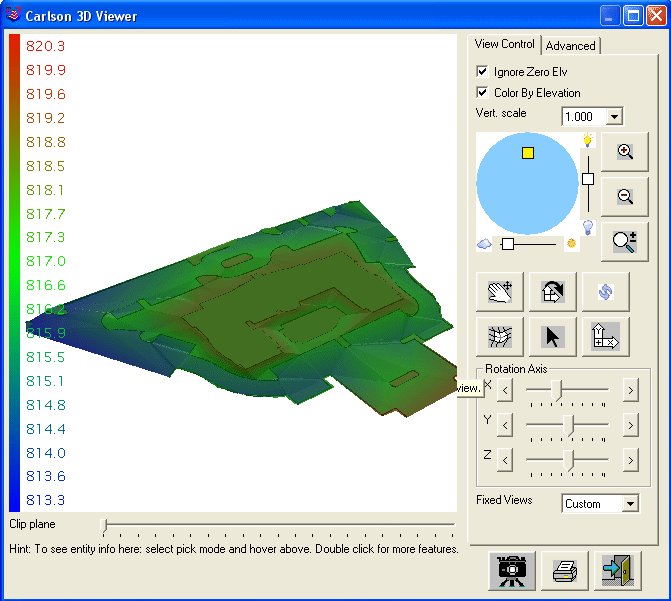
 The Carlson 3D Viewer gives you the ability to zoom
in and out, pan, rotate around the X,Y,Z axis and shade the
lighting. When you have orientated the model to your liking, click
on the Printer icon in the lower right corner of the
dialog.
 Here is an example of the Surface Graphic
Report.
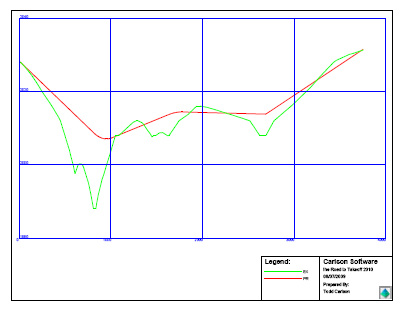
 The Profile Graphic Report creates a 3D view profile
of the site existing or design surface. You will first be prompted
for how to create the Profile:
"Pick starting point (CL-Centerline,P-Polyline)". CL prompts
you to load a previously created Centerline (.cl) file, P allows
you to pick any polyline in the plan view, or you can pick two
points on the screen that you want the program to create a profile
through. Next, you will be prompted for Title Block settings
similar in other Graphic Reports. Here is an example of the
Profile Graphic Report.
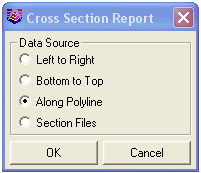
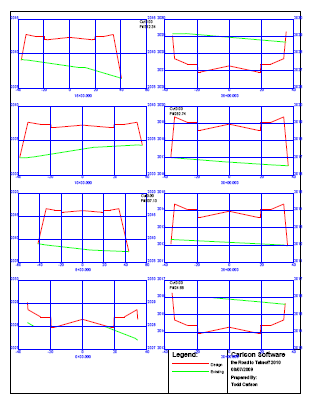
 The Section Graphic Report creates cross section in
a single step with option to include the plan view showing the
section alignment. Cross Sections can be created within the routine
from Left to Right, Bottom to Top, or along any polyline in the
drawing. For more control over the orientation of the cross
sections, Select Files allows you to select a previously created
section file (.sct).
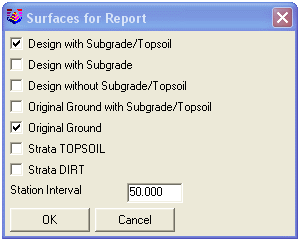
 Like many other Graphic Reports, several of
the surface models (.tin or .flt) created in the job can be used in
the report. Simply select the surfaces you want to see in the
report (there is no limit) and at what Station Interval (in feet)
you want to see them. Note: this is not an opinion when using a
.sct file.
 Here is an example of the Section Graphic
Report.
 Pulldown Menu Location: Tools > Graphic
Reports
Prerequisite: Existing and design surfaces
Keyboard Command: plotplan, plotsurf, tk_quickpro,
plotsct
 The Title Block Setup dialog draws a border and
title block for the selected sheet size. Here you can enter in text
you want to displayed in the report.
 Here is
an example of the Plan Graphic Report.
 The
Surface Graphic Report command creates a 3D view PDF report of any
surface (.tin or .flt files) created in the drawing, including
existing, design, and strata surfaces. In the first dialog, select
the surface you wish to see in the report. This dialog also gives
you the option to view the surface as a triangulation mesh or grid.
View Direction determines the orientation of the surface in the
next dialog.
 The Carlson 3D Viewer gives you the ability to zoom
in and out, pan, rotate around the X,Y,Z axis and shade the
lighting. When you have orientated the model to your liking, click
on the Printer icon in the lower right corner of the
dialog.
 Here is an example of the Surface Graphic
Report.
 The Profile Graphic Report creates a 3D view profile
of the site existing or design surface. You will first be prompted
for how to create the Profile:
 The Section Graphic Report creates cross section in
a single step with option to include the plan view showing the
section alignment. Cross Sections can be created within the routine
from Left to Right, Bottom to Top, or along any polyline in the
drawing. For more control over the orientation of the cross
sections, Select Files allows you to select a previously created
section file (.sct).
 Like many other Graphic Reports, several of
the surface models (.tin or .flt) created in the job can be used in
the report. Simply select the surfaces you want to see in the
report (there is no limit) and at what Station Interval (in feet)
you want to see them. Note: this is not an opinion when using a
.sct file.
 Here is an example of the Section Graphic
Report.
 Pulldown Menu Location: Tools > Graphic
Reports