SurvNet provides a window that graphically displays the survey network. Additionally the user is able to display error ellipses, and GPS vectors. The user has much control over how the network is displayed. The graphic tool is a useful tool in debugging networks since the raw data can be displayed prior to adjustment. If there are problems with the raw data the graphics often reflect the problem. The actual graphics cannot be output or saved. The graphics can be shown independent of whether the project has been processed.
The following snapshot shows a view of the graphic window. The graphic window can be accessed using the eye icon on the main tool bar. A project must be opened before the graphic window can be displayed. The graphics window will only display error ellipses after the project has been processed.
The tool bar in the graphics window contains buttons that allow the user to pan, zoom in, zoom out, zoom extents, and zoom to a window. Additionally there is a button that allows the user to navigate to points in the .CGR raw data editor. Also, there are buttons that will refresh the graphic, and change the graphic settings.
Pan:  Use this button to pan the graphics.
Zoom in:  Use this button to
zoom in on the graphics.
Use this button to
zoom in on the graphics.
Zoom out:  Use this button to
zoom out on the graphics.
Use this button to
zoom out on the graphics.
Zoom extent:  Use this button to zoom to the extents of the
graphics
Use this button to zoom to the extents of the
graphics
Zoom to window:  Use this button to zoom to the extents of a user
picked window.
Use this button to zoom to the extents of a user
picked window.
Pick Point.  This button
allows the user to navigate within the .CGR raw editor from the
graphics window. Currently this button serves no purpose when
working with .RW5 data..
This button
allows the user to navigate within the .CGR raw editor from the
graphics window. Currently this button serves no purpose when
working with .RW5 data..
Settings:  This buttons is used to change the
graphic display settings.
This buttons is used to change the
graphic display settings.
Refresh:  This button will
refresh the graphic view. Graphics are generated from the saved raw
data file. If you make changes to the raw file in the raw editor
you must save the file before the changes will be reflected in the
refreshed graphic screen.
This button will
refresh the graphic view. Graphics are generated from the saved raw
data file. If you make changes to the raw file in the raw editor
you must save the file before the changes will be reflected in the
refreshed graphic screen.
Following is a description of the
options in the graphics setting dialog box, which is accessed using
the tool bar button.
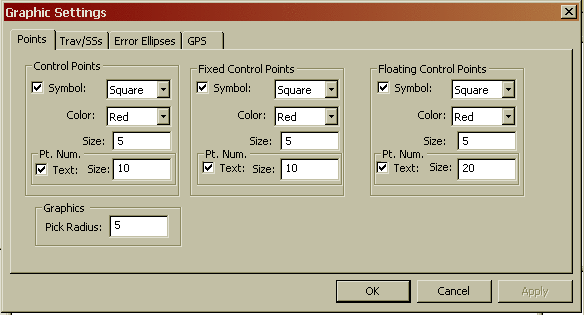
These settings determine how the different type control points are displayed in the graphics window. Different graphic settings can be applied to standard control points, fixed control points and floating control points. The symbol node display can be controlled as to symbol type, symbol color, symbol size. The control point name can be displayed and its size set from this setting dialog box.
The graphic pick radius defines a search radius. This radius is used when navigating the .CGR editor using the graphic window. You can pick a point graphically and the cursor in the editor will go to the next field containing that point number. The radius is defined in terms of the distance units of the raw data file.
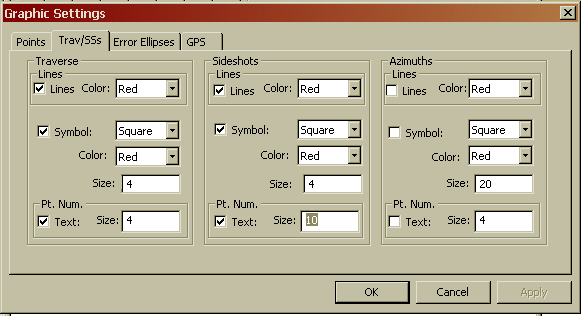
These settings determine how the network line work will be displayed for total station raw data. There are settings for traverse data, side shot data, and azimuth control. The program considers any point that has only a single angle and distance to it a side shot. The user can control the color of the traverse lines. The symbol node display can be controlled as to symbol type, symbol color, symbol size. The point name can be displayed and its size set from this setting dialog box.
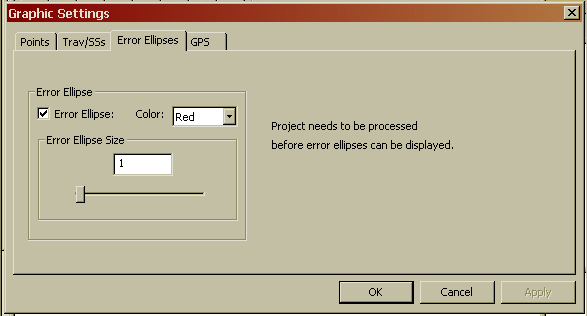
These settings determine how the error ellipses will be displayed in the graphic window. Error ellipses will only be displayed if there is a successful least squares adjustment. The display of the error ellipses is relative. The program automatically determines a default relative error ellipse size. The user can modify the visual size of the error ellipses using the track bar in the following dialog box. The user can also control the color of the error ellipse from the following dialog box.
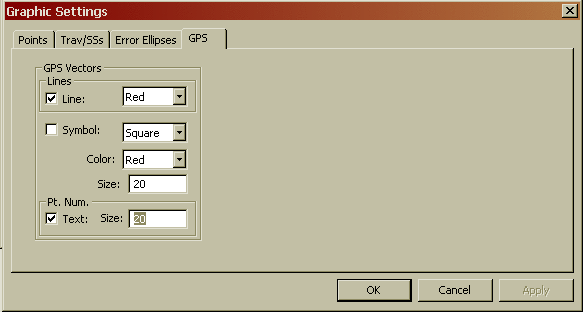
The settings in the following dialog box determine how GPS vectors will be displayed in the graphic window. The user can control the color of the GPS vector lines. The symbol node display can be controlled as to symbol type, symbol color, symbol size. The GPS point names can be displayed and their size set from this setting dialog box.