This command reports and labels the slope percent at user Screen
Picked points or Surface Points. Surface Points can work well on
grid files, (.GRD), but is typically too much information for
triangulated surface files (.TIN or .FLT).
The slope is computed from the surface model file (.TIN, .GRD,
or .FLT).
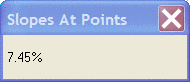
As the crosshairs are moved across the surface, the slope at the
current position is displayed in a floating dialog box.
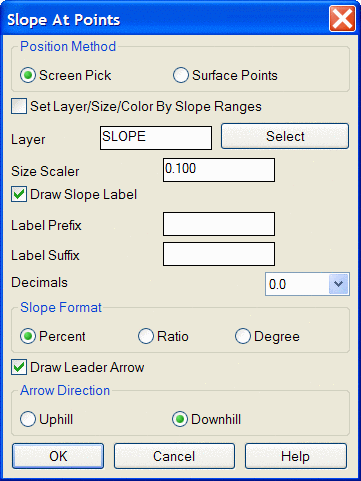
Slope At Points dialog box
Adjust settings as desired. Pick OK.
Select Surface
Model.
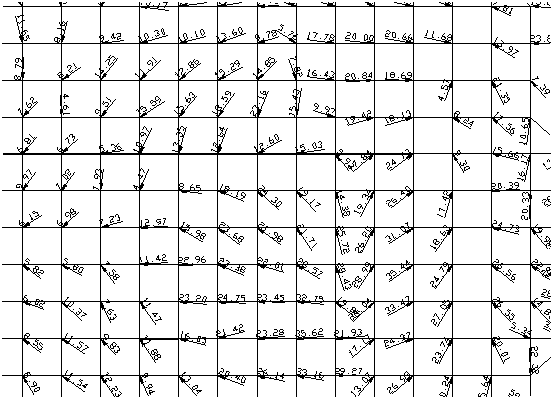
Pick Points to label slope.
|
|
| Draw grid file and Slope At Point labels using Surface Points |
Pulldown Menu Location: Surface >> Slope
Analysis
Keyboard Command: ptslope
Prerequisite: A surface model file (.TIN, .GRD, or
.FLT)