
This command labels cut/fill
quantities and creates a report at a grid interval over the site.
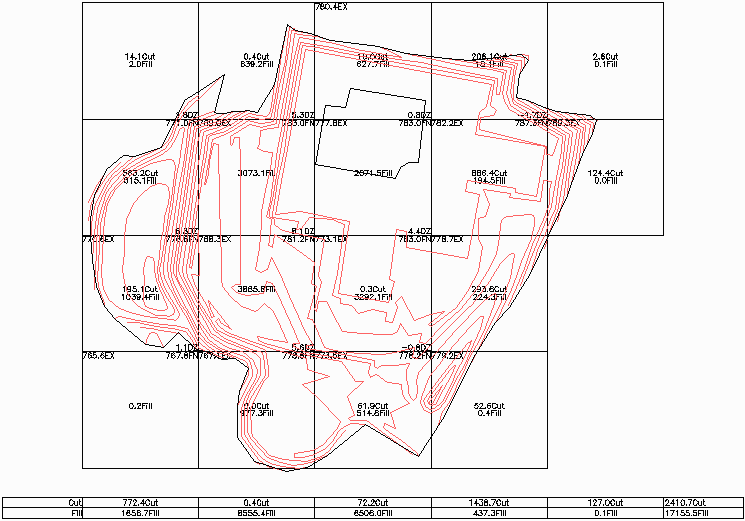
The grid cells are square at a specified size. The cut/fill
quantities are calculated separately within each grid cell. The
options dialog controls which cut/fill fields to label and the
label position within the grid cell. There is a summary row at the
bottom of the grid with the overall totals and sub-totals for each
column.
After the options dialog, the program
prompts for the corners for the area to grid. These corners should
create a window around the site.
Then after drawing the grids and
labels, the Report Formatter shows the cut/fill quantities for the
grid cells. You can choose which fields to include in the
report.
 Sample Report:
Cell Cut (C.Y.) Fill (C.Y.) Cut Area Fill Area Total Area
1 14.1 2.0 505.3 113.7 674.0
2 0.4 639.2 45.2 4693.4 4739.4
3 10.0 627.7 565.6 6691.1 7256.7...
----- Grand Total -----
2410.7 17155.5 30959.6 93877.1 125151.5