Cut/Fill Color Map

This command creates a cut/fill color map in red and blue in order to show the difference between grid or triangulation surfaces. The surface model sources can be either .tin, .flt, or .grd files.

For analyzing using the grid option, you need to already have two existing grid files. If the grids are not visible in plan view, you may want to have them display on-screen using the Draw 3D Grid File command. The grids should overlap with the same location and resolution. The resulting 
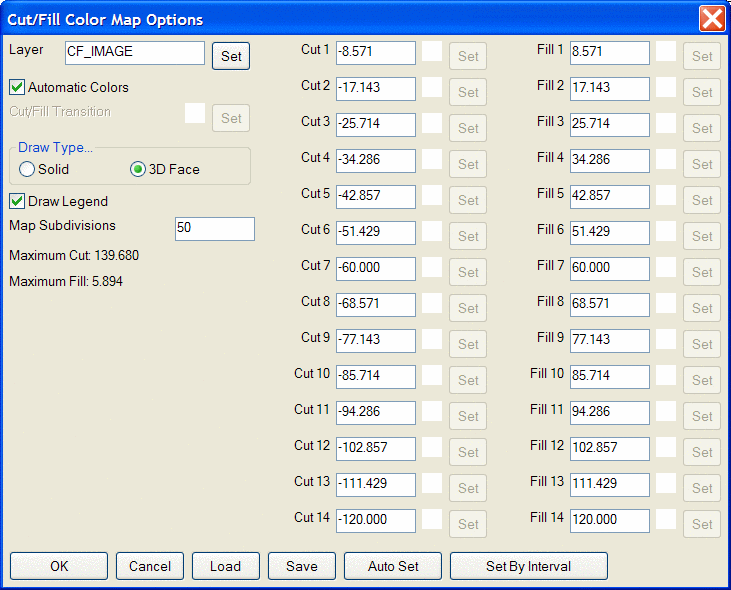
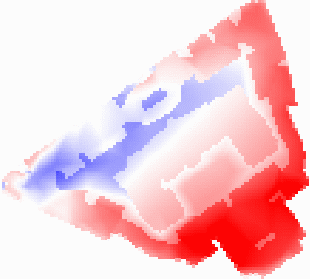
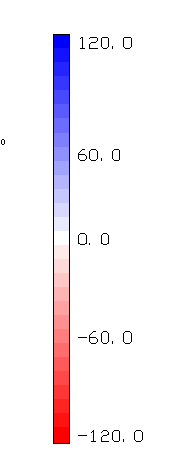
red/blue map with legend is shown below.

No mapping is calculated on tin or grid cells that extend beyond the extent of the data. Extrapolation can be used to calculate elevations for the grid cells that are beyond the data limits. The prompt Extrapolate grid to full grid size? shows when there are grid cells with no elevation in a grid (.GRD) file. Extrapolation fills in all the grid cells. The method to extrapolate uses a safe calculation that tends to average out or level the extrapolated values. So extrapolated grid areas are not as accurate as grid areas within the limits of the data.

Prompts

For a color map showing differences between two grids:
Type of surface model source [Tin/<Grid>]? press T for a Triangulation (.TIN) file, or press Enter to accept default choice in brackets.
Select Base Grid File Dialog
Select an existing .grd file.
Select Final Grid File Dialog Select a second existing .grd file.
Select Inclusion polyline:
pick a closed inclusion perimeter
Select Exclusion polylines (Enter for none).
Select objects: pick exclusion polylines or press Enter
Cut/Fill Color Map Options Dialog
Select point for color legend: pick a point
Legend size <10.0>: press Enter
Label all zones or summary [All/<Summary>]? press Enter

Pulldown Menu Location: Surface >> Cut/Fill Utilities
Keyboard Command:
cf_map
Prerequisite:
Two grid (.GRD), triangulation mesh (.FLT) or tin (.TIN) files