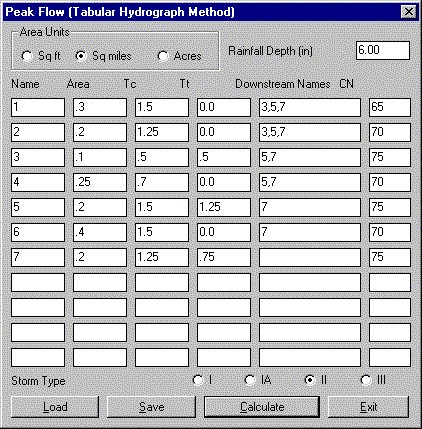
This command calculates peak flow using the tabular hydrograph method from the TR-55 program. The program is run through the dialog shown below. The Curve Numbers & Runoff and Time of Concentration routines can be used to calculate the subarea input values. When all the inputs are entered, click on the Calculate button. The input values can be saved to a file by clicking the Save button. Then the Load button can be used later to recall these entered values. The peak flow report lists the flow for each subarea at different time. The peak flow value is listed at the end of the report. This value can then be used for Detention Pond Sizing or Channel Design.
See the TR-55 manual for more details on this routine. One difference between Carlson and the TR-55 example is that Carlson interpolates the flow for the subarea Ia/P between the two nearest table Ia/P values whereas TR-55 uses the one closest Ia/P table entry. Consider a subarea with an Ia/P value of 0.14 and table entries of 100 cfs at 0.1 Ia/P and 75 cfs at 0.3 Ia/P. TR-55 would use 100 cfs from the nearest 0.1 Ia./P entry. Carlson would interpolate between 100 and 75 cfs resulting in 95 cfs.
Peak Flow Tabular Hydrograph Method


Subarea  Drainage  Time of   Travel   Downstream  Travel   Rainfall Curve  Runoff

name     area      concen-   time for subarea     time                     number

(sq. mi.)          tration   subarea  names       summation

1        0.3000    1.50      0.00     3,5,7       2.50       6.00    65     2.35

2        0.2000    1.25      0.00     3,5,7       2.50       6.00    70     2.81

3        0.1000    0.50      0.50     5,7         2.00       6.00    75     3.28

4        0.2500    0.75      0.00     5,7         2.00       6.00    70     2.81

5        0.2000    1.50      1.25     7           0.75       6.00    75     3.28

6        0.4000    1.50      0.00     7           0.75       6.00    70     2.81

7        0.2000    1.25      0.75                 0.00       6.00    75     3.28
Time    11.0  11.3  11.6  11.9  12.0  12.1  12.2  12.3

Subarea Discharge (cfs)

1       0     0     1     1     1     1     1     2

2       0     1     1     1     2     2     2     2

3       1     1     2     2     2     2     3     3

4       2     2     3     3     4     4     4     5

5       3     4     5     7     7     8     9     10

6       4     6     7     10    11    11    12    14

7       6     8     11    15    18    24    34    51

Total   17    23    30    40    45    53    65    87
Time    12.4  12.4  12.6  12.7  12.8  13.0  13.2  13.4

Subarea Discharge (cfs)

1       2     2     2     2     3     3     3     4

2       2     2     3     3     3     4     4     5

3       3     3     4     4     5     6     7     11

4       5     6     6     7     7     9     11    16

5       11    13    16    20    26    48    80    115

6       16    19    23    29    39    74    127   186

7       75    104   137   165   184   202   173   139

Total   114   149   189   230   267   345   406   475


Time    13.6  13.8  14.0  14.3  14.6  15.0  15.5  16.0

Subarea Discharge (cfs)

1       5     6     8     17    38    85    134   130

2       6     8     13    27    56    101   122   92

3       20    39    65    96    91    59    29    17

4       28    54    96    161   185   147   82    48

5       143   156   152   126   97    67    44    32

6       234   257   253   213   166   116   78    57

7       107   85    69    52    41    31    25    21

Total   544   606   654   692   674   608   516   397


Time    16.5  17.0  17.5  18.0  19.0  20.0  22.0  26.0

Subarea Discharge (cfs)

1       94    64    46    35    25    19    15    10

2       59    39    28    22    16    13    10    7

3       13    11    10    9     7     6     5     3

4       33    27    23    21    17    15    11    8

5       25    21    18    16    13    12    9     3

6       46    39    33    30    25    22    17    6

7       18    16    15    13    12    11    8     1

Total   289   217   173   146   115   99    74    39

Peak Discharge: 692 cfs

Pulldown Menu Location: Watershed
Keyboard Command: peakflow
Prerequisite: None